
What Is Average Order Value (AOV)?
Average Order Value (AOV) is a key ecommerce and retail metric that measures the average amount of money a customer spends in a single transaction. It is calculated by dividing your total revenue over a period by the total number of orders placed during that same period. AOV helps you understand customer spending behavior, evaluate marketing effectiveness, and set realistic revenue goals.
How to Use This Calculator
Enter your Total Revenue for the period (for example, monthly sales) and the Number of Orders received in that same period. The calculator instantly returns your average order value. Make sure both figures cover the exact same timeframe — mixing a month of revenue with a week of orders will give a misleading result.
The Formula Explained
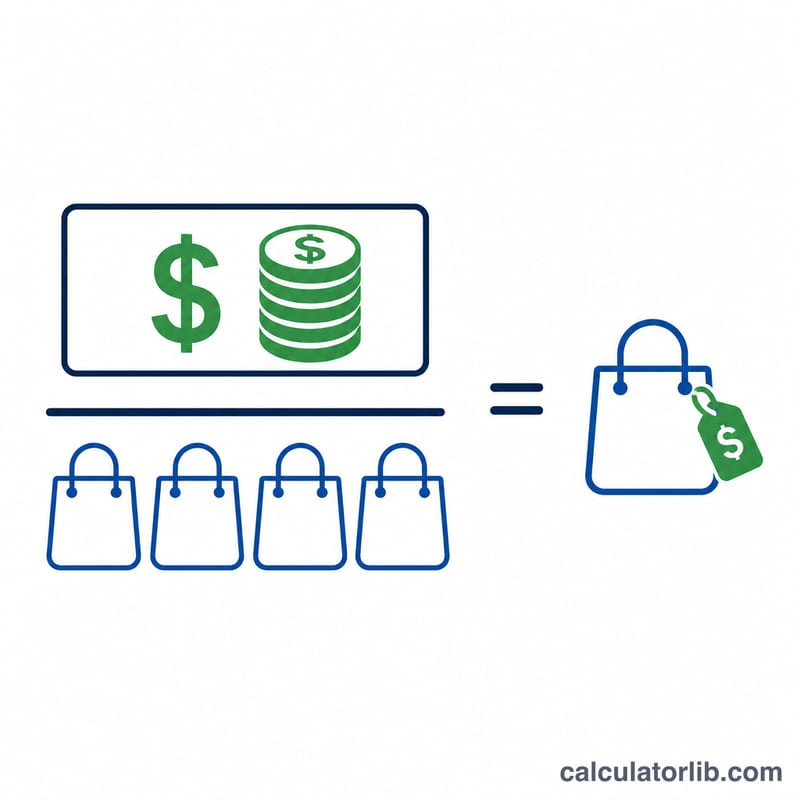
The formula is simple: $$\text{AOV} = \frac{\text{Total Revenue (\$)}}{\text{Number of Orders}}$$ Total revenue should typically be gross sales before refunds, though some businesses prefer net revenue. The number of orders counts each completed transaction once, regardless of how many items it contained. A rising AOV means customers are spending more per purchase, which improves profitability without needing more traffic.
Worked Example
Suppose an online store generated $50,000 in revenue from 500 orders last month. The AOV is $$\$50{,}000 \div 500 = \$100 \text{ per order}$$ If the store introduces upsells and pushes AOV to $120, that same 500 orders would generate $60,000 — a 20% revenue increase with zero extra customers.
Typical AOV Benchmarks by Industry
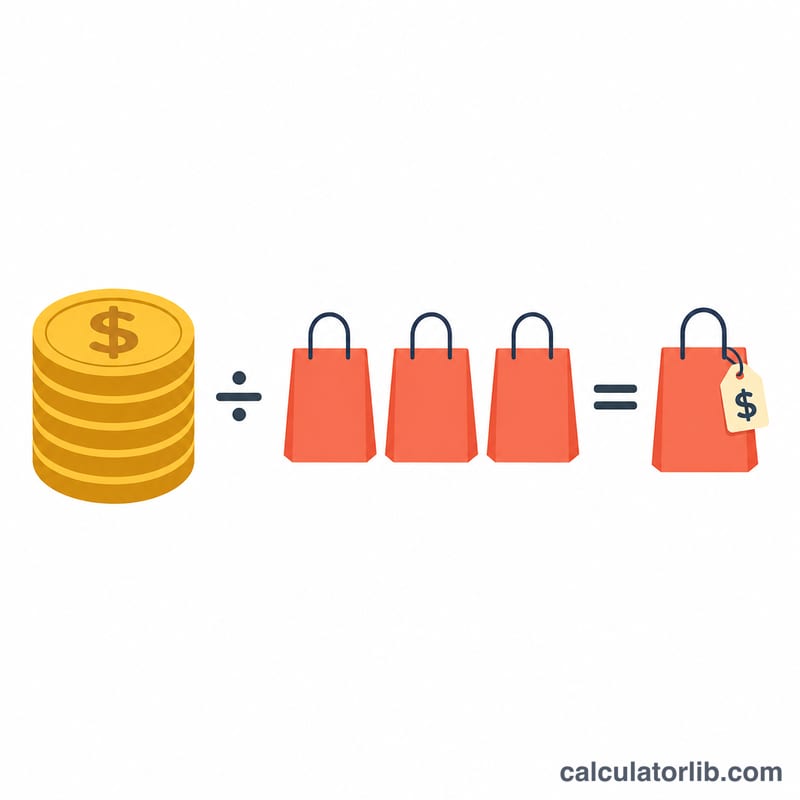
Average Order Value (AOV) varies widely between ecommerce categories because of differences in product price points, purchase frequency and basket composition. The ranges below are commonly cited industry estimates intended for rough orientation only — actual figures depend heavily on the data source, region, time period and the mix of products a store sells. Always benchmark against your own historical data first.
| Industry / Category | Typical AOV Range (USD) | Notes |
|---|---|---|
| Food & Beverage | $40 – $60 | High frequency, lower-priced baskets |
| Beauty & Cosmetics | $50 – $70 | Driven by bundles and replenishment |
| Fashion & Apparel | $80 – $120 | Seasonal swings; multi-item carts |
| Electronics | $150 – $250 | Higher ticket, lower frequency |
| Home & Furniture | $200+ | Large, infrequent purchases |
| Luxury Goods | $300+ | Premium pricing; small order counts |
These are illustrative industry estimates and vary considerably by source. Treat them as directional context rather than precise targets.
AOV Across Different Scenarios
AOV is calculated as total revenue divided by the number of orders:
$$\text{AOV} = \frac{\text{Total Revenue}}{\text{Number of Orders}}$$The scenarios below show how the same or similar revenue produces very different AOV depending on how many orders it is spread across. Raising AOV through upsells, bundles or higher minimums increases revenue without needing more orders, while attracting more lower-value orders pushes AOV down even as total revenue holds.
| Scenario | Total Revenue | Orders | AOV |
|---|---|---|---|
| Baseline | $50,000 | 500 | $100 |
| Fewer orders, same revenue (higher baskets) | $50,000 | 400 | $125 |
| More revenue from upsells | $75,000 | 500 | $150 |
| Many small orders (discount-driven) | $30,000 | 600 | $50 |
Notice that the baseline and the "fewer orders" scenario have identical revenue, but the second earns a higher AOV simply because each order is larger — a clear illustration of how upsells and cross-sells lift this metric.
Interpreting Your AOV
A higher AOV means each transaction generates more revenue, which can improve the efficiency of your marketing spend: if it costs the same to acquire a customer, a larger order recovers that cost faster. A lower AOV isn't inherently bad — many high-frequency businesses (such as food and beverage) operate profitably on small baskets purchased often. What matters is whether your AOV covers your costs and aligns with your business model.
AOV is closely tied to two other metrics:
- Customer Lifetime Value (CLV): A common estimate is \(\text{CLV} = \text{AOV} \times \text{Purchase Frequency} \times \text{Customer Lifespan}\). A higher AOV directly raises the lifetime value of each customer, which in turn justifies a higher acquisition budget.
- Customer Acquisition Cost (CAC): Comparing AOV (and CLV) against CAC shows whether you can afford to acquire customers profitably. If your AOV is $100 but it costs $120 to acquire a first-time buyer, you rely on repeat purchases to break even.
Context is essential when judging AOV. Industry norms, profit margins and traffic quality all shape what a "good" number looks like. A $250 AOV on a 10% margin can be less profitable than a $60 AOV on a 60% margin. Similarly, raising AOV through aggressive bundling may lift the figure while hurting conversion rate if shoppers balk at larger carts.
For that reason, AOV should never be evaluated in isolation. Pair it with your conversion rate (are visitors actually buying?) and repeat purchase rate (do customers come back?). A rising AOV alongside a falling conversion rate may signal that you're pricing out part of your audience, while a healthy AOV with strong repeat purchases points to a sustainable, profitable customer base.
Frequently Asked Questions
How can I increase my AOV? Common tactics include product bundling, free-shipping thresholds, upsells and cross-sells, volume discounts, and loyalty programs.
Should I use gross or net revenue? Either works as long as you are consistent. Net revenue (after refunds and discounts) gives a more accurate picture of realized sales.
How often should I track AOV? Monthly tracking is common, but reviewing it weekly during promotions helps you measure campaign impact quickly.