
What This Calculator Does
This calculator computes the three core measures of central tendency for any list of numbers: the mean (arithmetic average), the median (middle value), and the mode (most frequent value). It also reports the count, the sum, and the range so you have a quick statistical snapshot of your data set. It works for grades, test scores, prices, measurements, survey results, or any numeric data.
How to Use It
Type your numbers into the box, separated by commas or spaces — for example 4, 8, 15, 16, 23, 42. Decimals and negative numbers are allowed. Press calculate and the tool sorts the values, adds them up, and returns each statistic instantly. You can paste a long column copied from a spreadsheet; extra spaces and line breaks are handled automatically.
The Formulas Explained
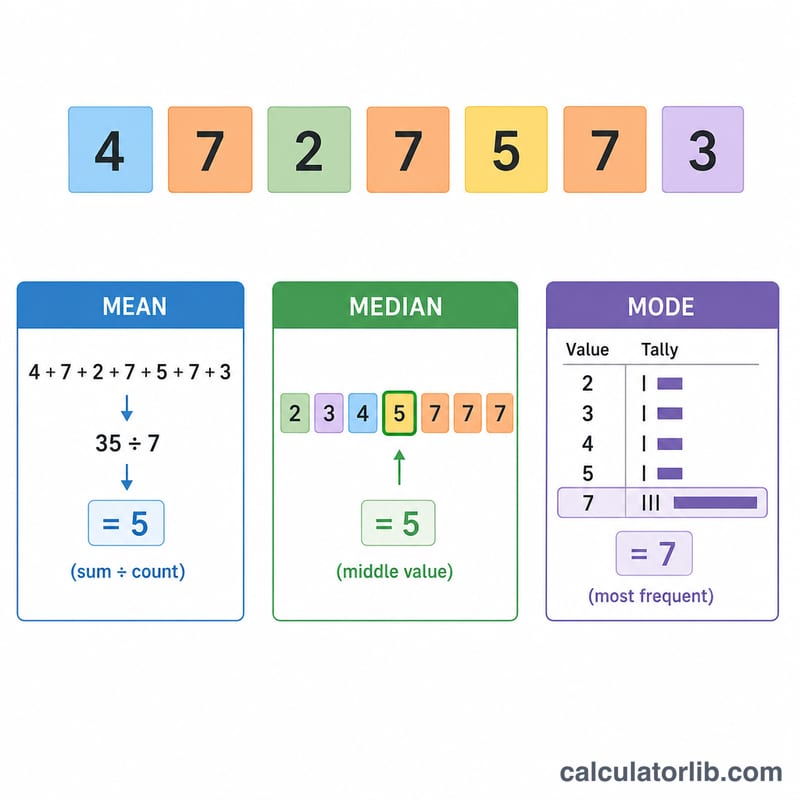
The mean is the sum of every value divided by how many values there are: \(\text{mean} = \sum x / n\). The median is found by sorting the numbers and taking the middle one; when there is an even number of values, it is the average of the two middle values. The mode is the value that appears most often. A data set can have one mode, several modes (multimodal), or no mode at all when every value is unique.
$$\text{Mean} = \frac{\sum_{i=1}^{n} x_i}{n}, \quad x_i \in \text{Numbers}$$ $$\text{Median} = \begin{cases} x_{\frac{n+1}{2}} & n \text{ odd} \\[4pt] \dfrac{x_{\frac{n}{2}} + x_{\frac{n}{2}+1}}{2} & n \text{ even} \end{cases}$$ $$\text{Mode} = \text{most frequent } x_i, \quad \text{Range} = x_{(n)} - x_{(1)}$$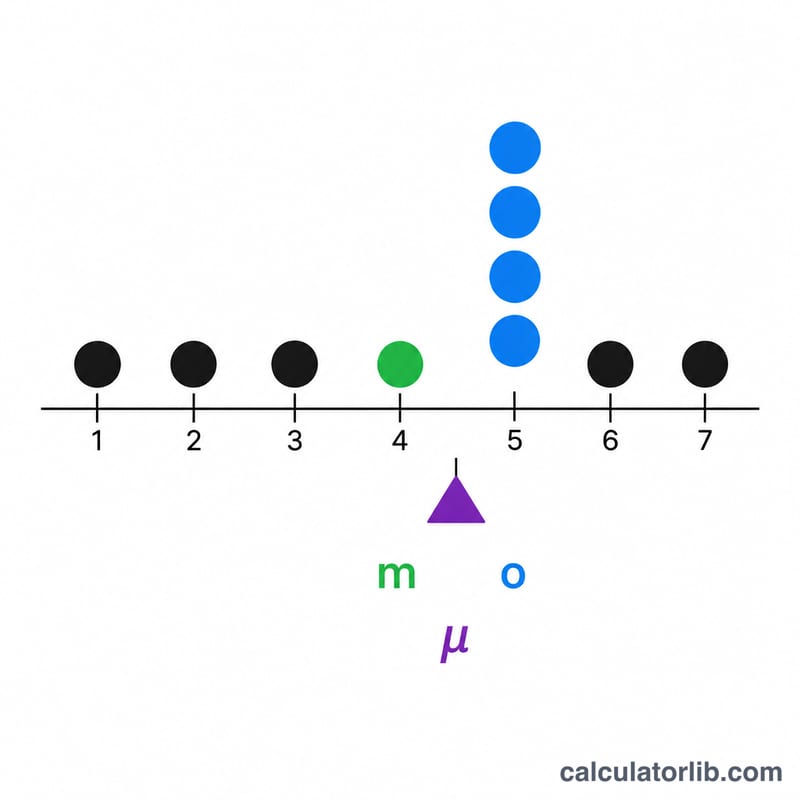
Worked Example
Take the set 2, 4, 4, 6, 9. The sum is \(2 + 4 + 4 + 6 + 9 = 25\) and there are 5 values, so the mean is \(25 \div 5 = 5\). Sorted, the middle (3rd) value is 4, so the median is 4. The value 4 appears twice — more than any other — so the mode is 4. The range is \(9 - 2 = 7\).
Interpreting Your Results
The three measures of central tendency answer the same broad question — "what is a typical value?" — but they respond differently to the shape of your data, so reading them together is more informative than reading any one alone.
When the mean and median diverge
In a perfectly symmetric data set the mean and median are equal. When they separate, the gap signals skew: if the mean is noticeably larger than the median, a few unusually high values (right-skew, or high outliers) are pulling the average upward; if the mean is smaller than the median, low values are dragging it down (left-skew). Because the mean adds every value, a single extreme observation can shift it substantially, while the median — the middle of the sorted list — barely moves. For skewed data such as incomes, home prices or response times, the median is usually the more representative "typical" value.
When a multimodal result signals subgroups
The mode is the most frequent value. A single clear mode suggests the data clusters around one center. Two or more modes (a bimodal or multimodal result) often mean the data set actually mixes distinct subgroups — for example test scores from two different classes, or measurements taken under two different conditions. When that happens, a single mean or median can describe a value that is not actually typical of either group, so it is worth checking whether the data should be split and analyzed separately.
How range indicates spread
The range is the largest value minus the smallest, so it captures the full width of the data in one number. A small range relative to the mean indicates the values are tightly clustered; a large range indicates greater spread or the presence of outliers. Range uses only the two most extreme points, so it is sensitive to outliers and says nothing about how the values in between are distributed — pair it with a standard deviation or variance when you need a more complete picture of dispersion.
This section explains standard statistical interpretation only and is not personal, financial or professional advice.
How Mean, Median and Mode Compare Across Data Sets
The four data sets below each contain a similar number of values but different shapes. Notice how the mean tracks the median for symmetric data but separates from it once an outlier or skew is introduced, while the mode highlights repetition and clustering.
| Data set | Values | Mean | Median | Mode | Range |
|---|---|---|---|---|---|
| Symmetric | 4, 5, 6, 7, 8 | 6 | 6 | none | 4 |
| Right-skewed (high outlier) | 4, 5, 6, 7, 80 | 20.4 | 6 | none | 76 |
| Bimodal (two subgroups) | 2, 2, 2, 9, 9, 9 | 5.5 | 5.5 | 2 and 9 | 7 |
| All-unique | 3, 11, 14, 22, 30 | 16 | 14 | none | 27 |
In the right-skewed set, replacing the value 8 with 80 leaves the median unchanged at 6 but lifts the mean to 20.4 — a clear demonstration of how one outlier distorts the average while the median stays robust. The bimodal set returns two modes, the statistical clue that two clusters (each centered on 2 and on 9) have been combined. The all-unique set has no mode at all, because no value repeats.
Definitions & Glossary
- Mean (arithmetic average)
- The sum of all values divided by the count of values, \(\bar{x} = \frac{\sum x_i}{n}\). Uses every value, so it is sensitive to outliers.
- Median
- The middle value when the data is sorted in order. With an even count it is the average of the two central values. Largely unaffected by extreme values.
- Mode
- The value (or values) that occur most often. A data set may have one mode, several modes, or none if every value is unique.
- Central tendency
- A single value that summarizes the center or "typical" level of a data set; the mean, median and mode are the three common measures.
- Multimodal
- Having more than one mode. Two modes is called bimodal; multimodal data often indicates a mixture of distinct subgroups.
- Range
- The difference between the largest and smallest values, \(\text{range} = x_{\max} - x_{\min}\); a simple measure of overall spread.
- Count (n)
- The number of values in the data set — the divisor used when computing the mean.
- Sum
- The total obtained by adding all values together, \(\sum x_i\); the numerator of the mean.
- Outlier
- A value that lies far from the rest of the data. Outliers strongly affect the mean and range but have little effect on the median.
- Sorted / ordered data
- Values arranged from smallest to largest. Ordering is required to locate the median and to read off the minimum and maximum for the range.
FAQ
What if my data has no repeated values? Then there is no mode, and the calculator displays "No mode."
Can there be more than one mode? Yes. If two or more values tie for the highest frequency, all of them are listed as modes.
Which average should I use? The mean is best for symmetric data, but the median is more reliable when there are extreme outliers, since it is not pulled toward unusually large or small values.