What Is the Information Ratio?
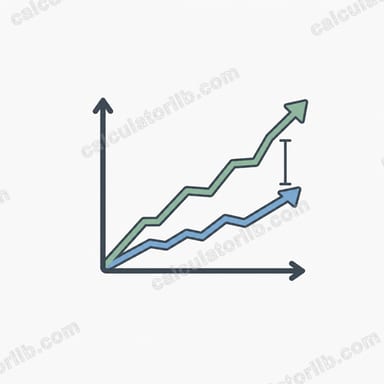
The Information Ratio (IR) measures how much excess return a portfolio generates relative to a benchmark, per unit of risk taken in pursuing that excess return. It is a core metric for evaluating the skill of active managers: a higher IR means the manager is producing consistent active return without taking on disproportionate active risk.
How to Use This Calculator
Enter three figures: the portfolio's return, the benchmark's return, and the tracking error (the standard deviation of the difference between portfolio and benchmark returns). The calculator subtracts the benchmark return from the portfolio return to get the active return, then divides by the tracking error to give the Information Ratio. Use consistent periods — for example, all annualized percentages.
The Formula Explained
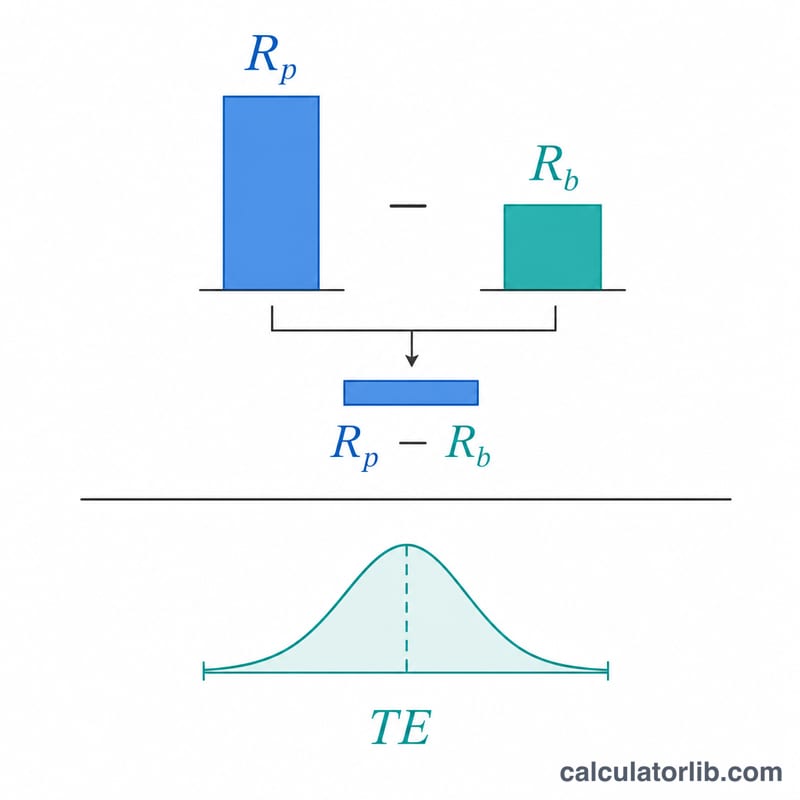
$$\text{IR} = \frac{R_{\text{portfolio}} - R_{\text{benchmark}}}{\text{Tracking Error}}$$ The numerator is the active (excess) return. The denominator, tracking error, is the volatility of that active return. Dividing the two normalizes return for the amount of active risk taken. As a rough guide, an IR around \(0.5\) is good, \(0.75\) is very good, and \(1.0\) or above is exceptional.
Worked Example
Suppose a fund returned 8%, its benchmark returned 5%, and the tracking error was 4%. The active return is \(8\% - 5\% = 3\%\). The Information Ratio is $$\frac{3\%}{4\%} = 0.75.$$ This indicates the manager added \(0.75\) units of active return for each unit of active risk — a strong result.
FAQ
How is IR different from the Sharpe ratio? The Sharpe ratio compares excess return over the risk-free rate to total volatility. The Information Ratio compares excess return over a benchmark to tracking error (active risk).
What is a good Information Ratio? Values of \(0.4\)–\(0.6\) are considered good, and above \(1.0\) is rare and excellent over sustained periods.
Can the IR be negative? Yes. A negative IR means the portfolio underperformed its benchmark on a risk-adjusted basis.