What Is the Sharpe Ratio?
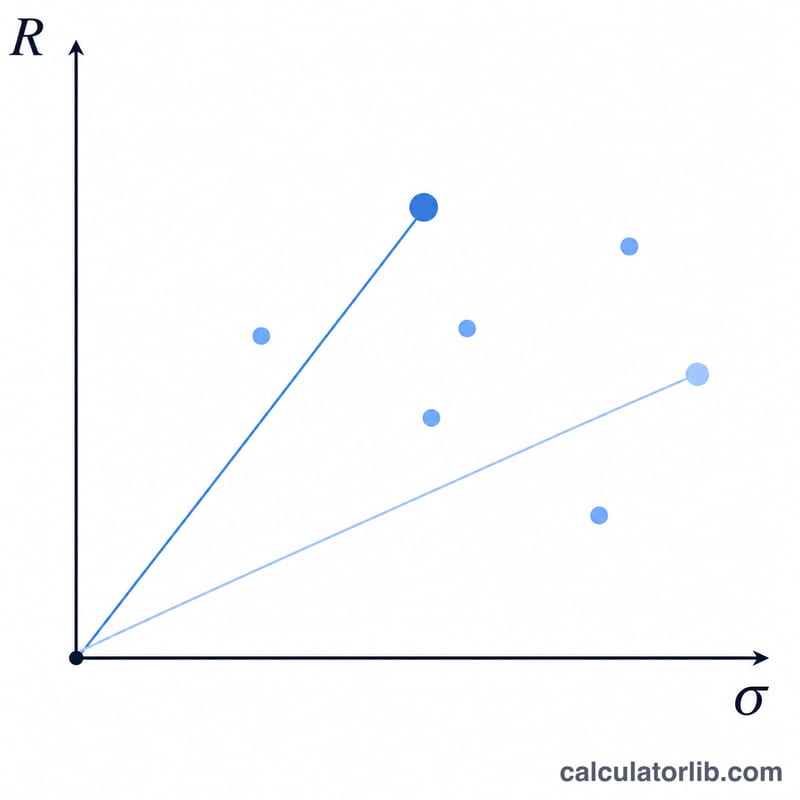
The Sharpe ratio, developed by Nobel laureate William F. Sharpe, measures how much excess return an investment generates for each unit of risk taken. It lets you compare portfolios or funds on a level playing field: a higher Sharpe ratio means better risk-adjusted performance. The metric is universal and used by investors worldwide.
How to Use This Calculator
Enter three figures: your portfolio's return (%), the risk-free rate (%) — typically a short-term government bond or Treasury yield — and the standard deviation (%) of your portfolio's returns, which represents its volatility. The calculator instantly returns the Sharpe ratio and the excess return.
The Formula Explained
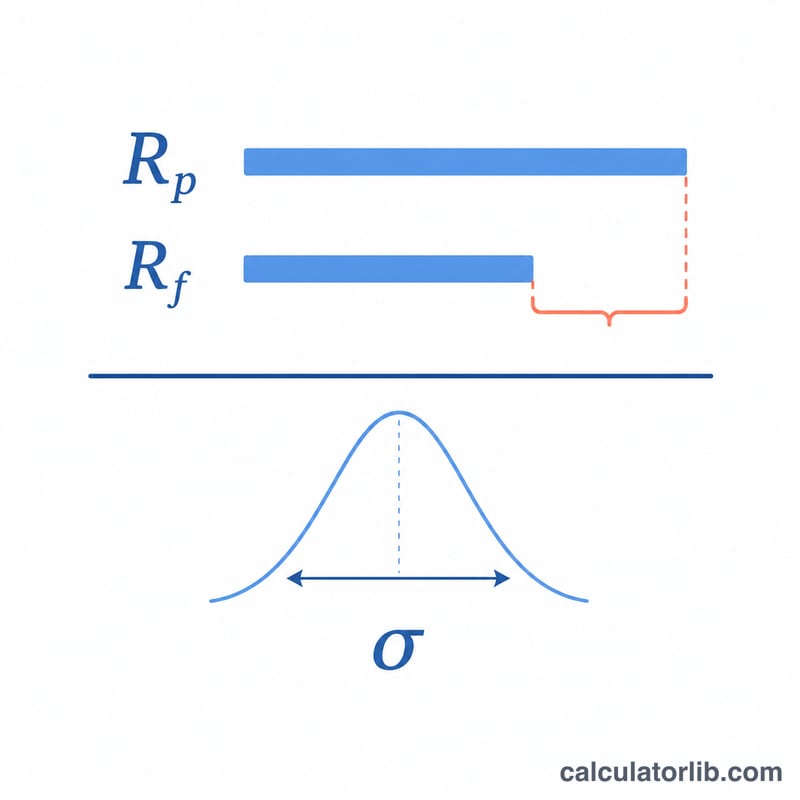
The formula is $$\text{Sharpe} = \frac{R_p - R_f}{\sigma_p}$$ The numerator \((R_p - R_f)\) is the excess return — how much you earned above a "free" benchmark. Dividing by \(\sigma_p\), the standard deviation, scales that reward by the volatility you endured. A ratio above 1.0 is generally considered good, above 2.0 very good, and above 3.0 excellent.
Worked Example
Suppose a portfolio returned 12%, the risk-free rate is 3%, and the standard deviation is 10%. The excess return is \(12 - 3 = 9\%\). Dividing by 10 gives a Sharpe ratio of 0.9 — decent but below the 1.0 threshold many investors target.
FAQ
What is a good Sharpe ratio? Generally, above 1.0 is acceptable, above 2.0 is good, and above 3.0 is excellent, though it depends on asset class and time period.
Can the Sharpe ratio be negative? Yes. If the portfolio return is below the risk-free rate, the excess return is negative, producing a negative Sharpe ratio — meaning you took risk for a sub-risk-free outcome.
What inputs should be consistent? All three figures should reflect the same time horizon (e.g., annualized) so the ratio is meaningful.