What Is the Treynor Ratio?
The Treynor ratio, developed by economist Jack Treynor, measures the excess return a portfolio generates per unit of systematic risk, as measured by beta. Unlike the Sharpe ratio, which divides excess return by total volatility (standard deviation), the Treynor ratio uses only market-related risk. This makes it especially useful for evaluating well-diversified portfolios where unsystematic risk has largely been eliminated.
How to Use This Calculator
Enter three values: your portfolio's return, the risk-free rate (often a Treasury bill yield), and the portfolio's beta relative to the market. The calculator returns the Treynor ratio. A higher value indicates better reward for the market risk taken. The ratio is a relative measure — it is most meaningful when comparing two or more portfolios over the same period.
The Formula Explained
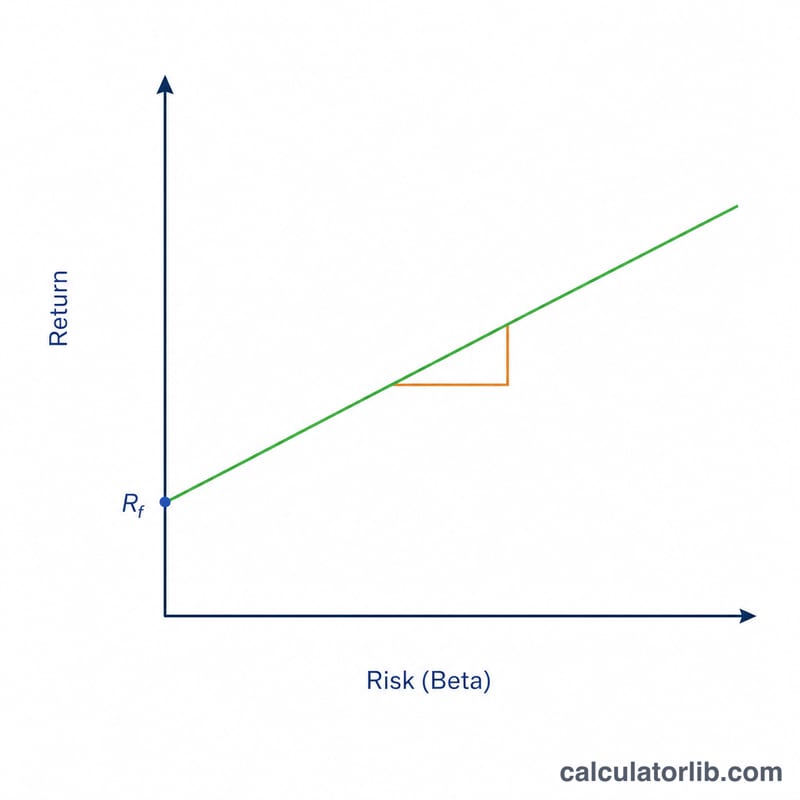
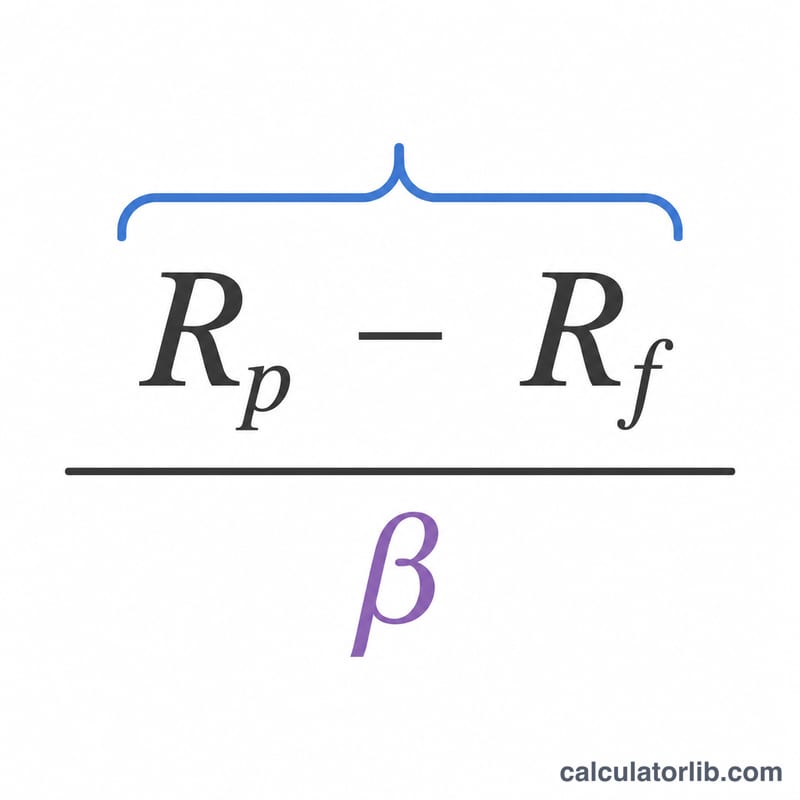
The formula is $$\text{Treynor Ratio} = \frac{\text{Portfolio Return (\%)} - \text{Risk-Free Rate (\%)}}{\text{Portfolio Beta}}$$ or \(T = (R_p - R_f) / \beta\). The numerator, \(R_p - R_f\), is the excess return earned above the risk-free rate. Dividing by beta scales that excess return by sensitivity to overall market movements. A beta of 1 means the portfolio moves with the market; a beta above 1 amplifies market swings, while below 1 dampens them.
Worked Example
Suppose a portfolio returned 12%, the risk-free rate is 2%, and the portfolio beta is 1.2. The excess return is \(12\% - 2\% = 10\%\). Dividing by the beta gives $$10 / 1.2 \approx 8.33$$ So the Treynor ratio is about 8.33, meaning the portfolio earned roughly 8.33 percentage points of excess return for each unit of market risk.
FAQ
Treynor vs. Sharpe ratio? Sharpe uses total risk (standard deviation); Treynor uses only systematic risk (beta). Use Treynor for diversified portfolios and Sharpe for less-diversified or standalone investments.
What is a good Treynor ratio? There is no universal threshold — higher is better, and it should be compared against a benchmark or other portfolios over the same timeframe.
Can the ratio be negative? Yes. If the portfolio underperforms the risk-free rate, or beta is negative, the result can be negative, signaling poor risk-adjusted performance.