
What is the BMI Category Score Calculator?
Body Mass Index (BMI) is a simple screening number that relates your weight to your height. This calculator computes your BMI from metric inputs and assigns the standard World Health Organization weight category so you can quickly see where you fall on the scale.
How to use it
Enter your weight in kilograms and your height in centimetres, then submit. The tool converts your height to metres, squares it, divides your weight by that value, and reports both the numeric BMI and its category label.
The formula explained
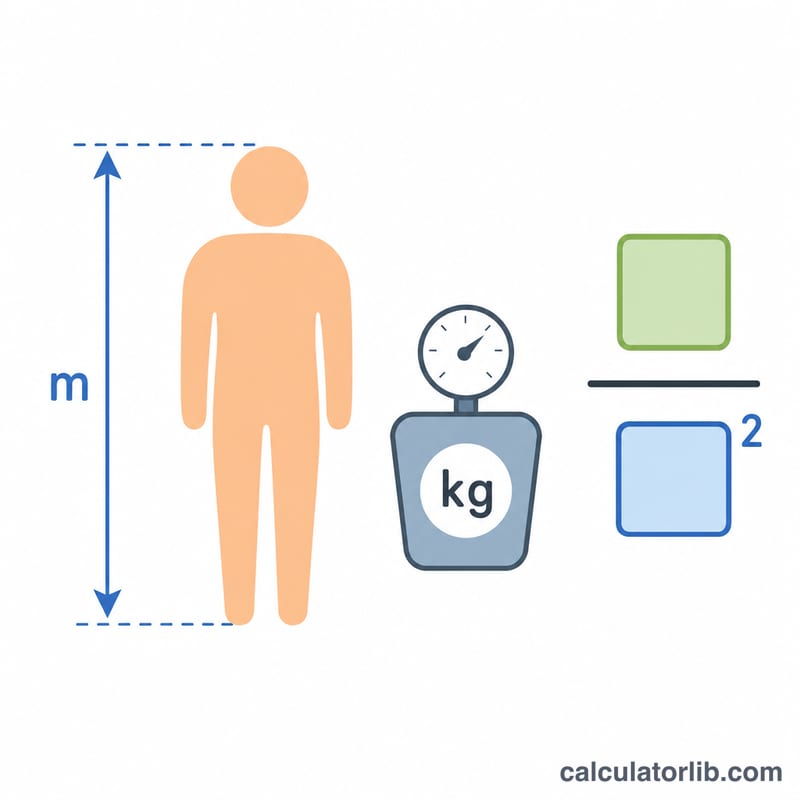
The equation is
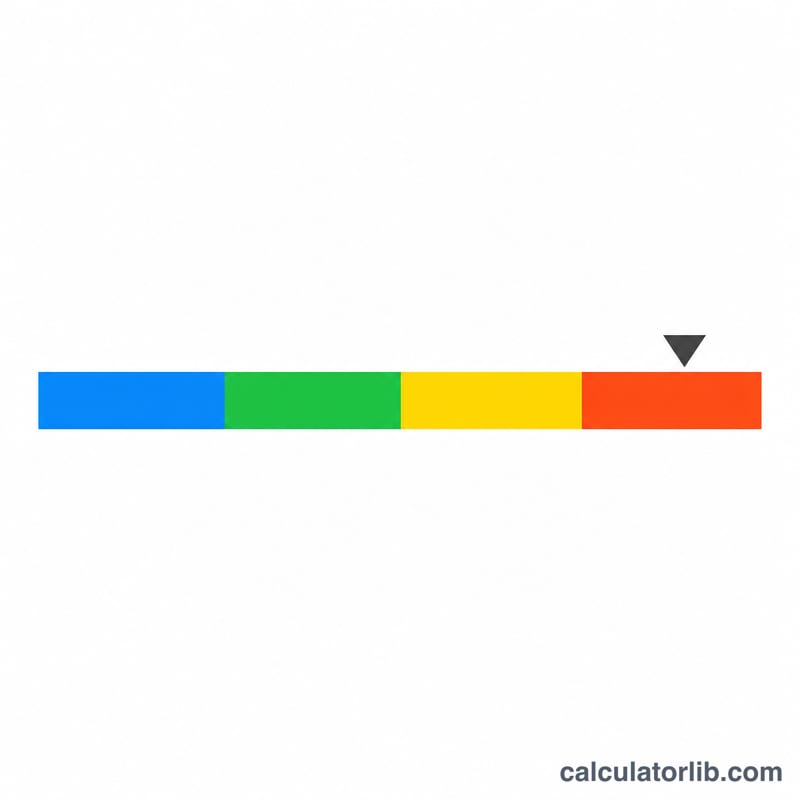
$$\text{BMI} = \frac{\text{Weight (kg)}}{\left(\dfrac{\text{Height (cm)}}{100}\right)^2}$$Height must be in metres, so a height entered in centimetres is divided by 100 first. The categories are: under 18.5 = Underweight, 18.5–24.9 = Normal weight, 25–29.9 = Overweight, and 30 or above = Obese.
Worked example
Suppose you weigh 70 kg and stand 175 cm tall. Convert height: \(175 \div 100 = 1.75\) m. Square it: \(1.75^2 = 3.0625\). Then
$$\text{BMI} = 70 \div 3.0625 \approx 22.86 \ \text{kg/m}^2$$which falls in the Normal weight range.
WHO BMI Category Reference Table
The World Health Organization (WHO) classifies body mass index for adults into the categories shown below. BMI is calculated as weight in kilograms divided by the square of height in metres: \(\text{BMI} = \dfrac{\text{weight (kg)}}{(\text{height (m)})^2}\). These cut-offs apply to adults aged 20 and over and are independent of sex.
| Category | Sub-classification | BMI range (kg/m²) |
|---|---|---|
| Underweight | Severe thinness | < 16.0 |
| Moderate thinness | 16.0 – 16.9 | |
| Mild thinness | 17.0 – 18.4 | |
| Normal weight | — | 18.5 – 24.9 |
| Overweight (pre-obese) | — | 25.0 – 29.9 |
| Obese class I | Moderate | 30.0 – 34.9 |
| Obese class II | Severe | 35.0 – 39.9 |
| Obese class III | Very severe / morbid | ≥ 40.0 |
Worked example: a person weighing 70 kg at 175 cm tall has a BMI of \(\dfrac{70}{(1.75)^2} = \dfrac{70}{3.0625} =\) 22.9, which falls in the Normal weight category.
Interpreting Your BMI Result
BMI is a population-level screening indicator, not a diagnosis. It estimates whether your weight is in a range associated with higher or lower health risk for the average adult, but it cannot measure body fat directly or assess the health of any one individual.
- Underweight (< 18.5): may signal undernutrition or an underlying condition; associated at the population level with risks such as weakened immunity and bone loss.
- Normal (18.5 – 24.9): the range associated with the lowest average risk of weight-related disease for most adults.
- Overweight (25 – 29.9): a screening signal of increased average risk of conditions such as type 2 diabetes and cardiovascular disease.
- Obese (≥ 30): associated with progressively higher average risk across classes I–III.
Important limitations
BMI uses only weight and height, so it cannot distinguish muscle from fat or show where fat is stored. Common situations where BMI can mislead include:
- Muscle mass: athletes and very muscular people may have a high BMI with low body fat.
- Body composition & age: older adults may carry more fat at the same BMI, while BMI does not capture fat distribution (waist circumference is a useful complement).
- Ethnicity: health risk can rise at lower BMI values in some populations. WHO and many guidelines suggest lower action points for people of Asian descent — for example overweight from about 23 and obesity from about 27.5 kg/m².
- Children, pregnancy: the adult cut-offs above do not apply; age- and sex-specific charts are used instead.
Use BMI as one starting signal alongside other measures. This is general information for screening purposes only and is not medical advice or a diagnosis; consult a qualified healthcare professional about your individual health.
Weight & Height Unit Conversions
This calculator uses metric units (kilograms and centimetres). Use the factors below to convert from imperial measurements before entering them.
Conversion factors
- Weight: \(1\ \text{kg} = 2.205\ \text{lb}\), and \(1\ \text{lb} = 0.4536\ \text{kg}\)
- Height: \(1\ \text{in} = 2.54\ \text{cm}\), and \(1\ \text{cm} = 0.3937\ \text{in}\)
- Feet to centimetres: \(1\ \text{ft} = 30.48\ \text{cm}\) (12 inches)
Common weight conversions
| Kilograms (kg) | Pounds (lb) |
|---|---|
| 50 | 110.2 |
| 60 | 132.3 |
| 70 | 154.3 |
| 80 | 176.4 |
| 90 | 198.4 |
| 100 | 220.5 |
Common height conversions
| Centimetres (cm) | Inches (in) | Feet & inches |
|---|---|---|
| 160 | 63.0 | 5 ft 3 in |
| 165 | 65.0 | 5 ft 5 in |
| 170 | 66.9 | 5 ft 7 in |
| 175 | 68.9 | 5 ft 9 in |
| 180 | 70.9 | 5 ft 11 in |
| 185 | 72.8 | 6 ft 1 in |
Example conversion: \(175\ \text{cm} \times 0.3937 = 68.9\ \text{in} = 5\ \text{ft}\ 8.9\ \text{in}\), which rounds to about 5 ft 9 in. To convert pounds back to kilograms for entry, divide by 2.205 — e.g. \(154.3 \div 2.205 = 70\ \text{kg}\).
FAQ
Is BMI accurate for everyone? No. BMI does not distinguish muscle from fat, so very muscular people may score "overweight" while being healthy. It is a population screening tool, not a diagnosis.
Does BMI differ by sex or age? The adult BMI formula is the same for all adults. Children and teens use age- and sex-specific percentiles instead.
What units does this use? Metric: kilograms and centimetres. To use pounds and inches, convert first (\(1 \ \text{kg} \approx 2.205 \ \text{lb}\), \(1 \ \text{inch} = 2.54 \ \text{cm}\)).