
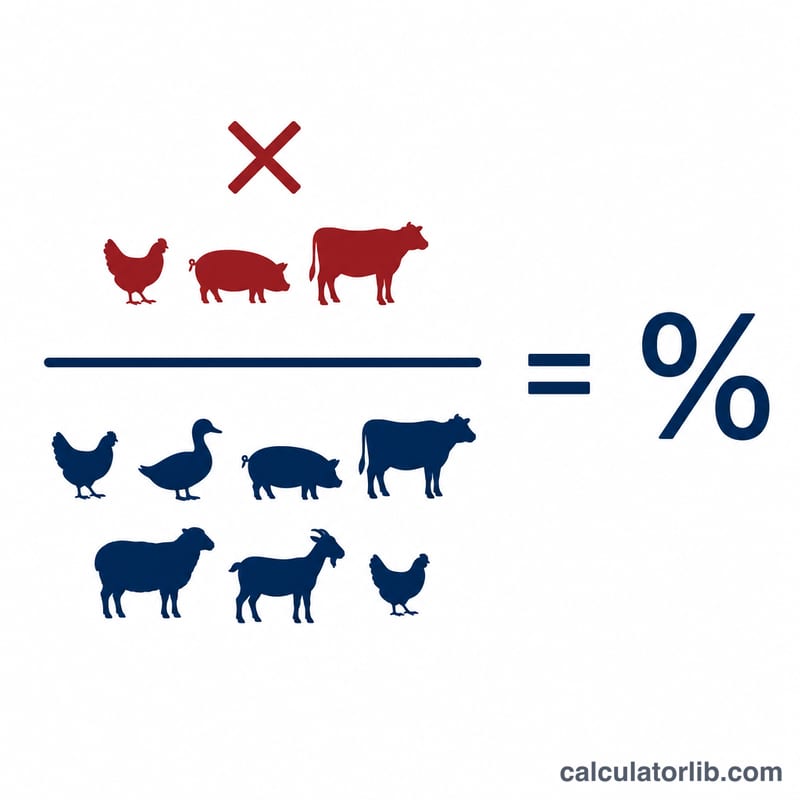
What Is the Animal Mortality Rate Calculator?
The Animal Mortality Rate Calculator measures the proportion of a herd, flock, brood, or population that died over a given period. It converts a raw death count into a clear percentage, making it easy to compare losses across farms, hatcheries, fisheries, kennels, or research and conservation programs of different sizes. A flat number like "40 deaths" means very little on its own; expressed as a rate, it becomes a meaningful benchmark.
How to Use It
Enter two values: the number of deaths during the period and the total population at the start of that period. The calculator returns the mortality rate as a percentage, along with the number of survivors and the survival rate. Use a consistent timeframe (per cycle, per month, per production batch) so your figures stay comparable.
The Formula Explained
The calculation is straightforward:
$$\text{Mortality Rate (\%)} = \frac{\text{Number of Deaths}}{\text{Total Population at Start}} \times 100$$
Deaths are divided by the starting population to get a fraction, then multiplied by 100 to express it as a percentage. The survival rate is simply 100% minus the mortality rate.
Worked Example
Suppose a poultry flock starts with 500 birds and 25 die during the grow-out period. $$\text{Mortality Rate} = \frac{25}{500} \times 100 = \textbf{5\%}$$ Survivors = \(500 - 25 = 475\), giving a survival rate of 95%. A 5% loss is generally considered acceptable for broiler flocks, so this batch is performing within a normal range.
Typical Mortality Rate Benchmarks by Species
The table below lists general, widely-referenced mortality benchmarks used in animal husbandry, veterinary, and aquaculture settings. These figures are typical or acceptable ranges drawn from documented industry baselines — they are reference points, not regulatory standards. Actual acceptable mortality varies with breed, climate, housing, disease pressure, age class, and the length of the production cycle, so always compare your result against benchmarks for the same animal, life stage, and timeframe.
| Animal type / system | Life stage or period | Typical mortality reference |
|---|---|---|
| Broiler poultry (meat chickens) | Whole grow-out cycle (~6 weeks) | Under 5% |
| Layer hens (egg flocks) | Per laying year | ~3–6% |
| Turkeys (commercial) | Whole grow-out cycle | ~5–10% |
| Swine — piglets (pre-weaning) | Birth to weaning | ~10–15% |
| Swine — grow/finish pigs | Weaning to market | ~3–5% |
| Beef cattle (cow-calf) | Calf, birth to weaning | ~3–5% |
| Dairy calves (pre-weaning) | Birth to weaning | ~5–8% |
| Adult dairy cows | Per lactation year | ~2–7% |
| Sheep — lambs | Birth to weaning | ~10–15% |
| Aquaculture fish (grow-out) | Stocking to harvest | ~10–20% |
| Fish fry / fingerlings (hatchery) | Early rearing | Often 20–50%+ (high natural loss) |
| Shelter / rescue (dogs & cats) | In-care population | Low single digits in well-run facilities |
As a worked check: if a broiler flock starts with 20,000 birds and 600 die over the cycle, the mortality rate is \(\frac{600}{20{,}000}\times100\% =\) 3%, which sits within the typical broiler benchmark of under 5%.
Definitions & Glossary
- Mortality rate
- The proportion of animals that died during a defined period, expressed as a percentage of the starting (at-risk) population: \(\text{Mortality Rate}=\frac{\text{Deaths}}{\text{Population}}\times100\%\).
- Survival rate
- The complement of mortality — the percentage of the starting population still alive at the end of the period: \(100\% - \text{Mortality Rate}\). For example, a 4% mortality rate corresponds to a 96% survival rate.
- Starting / at-risk population
- The number of animals present and exposed to the risk of death at the beginning of the period being measured. This is the denominator in the formula. For accuracy it should reflect the count at the start of the cycle, not a later or partial headcount.
- Deaths
- The count of animals that died during the period, including those that died of disease, injury, or were culled/euthanized if your accounting treats culls as mortality. Be consistent about whether culls are included so comparisons stay meaningful.
- Production cycle / period
- The fixed window of time over which deaths are counted — for example a single broiler grow-out, one laying year, or a hatchery rearing batch. Mortality figures are only comparable when they cover the same length of cycle.
- Why a consistent timeframe matters
- Mortality accumulates over time, so a rate quoted over six weeks is not comparable to one quoted over a full year. Always state the period alongside the percentage, and benchmark against figures measured over the same window and life stage. Mixing timeframes is the most common source of misleading mortality comparisons.
FAQ
What counts as a "good" mortality rate? It depends on the species and production system. Broiler poultry often target under 5%, while some aquaculture or wildlife contexts tolerate higher figures. Always compare against your own historical baseline.
Should I use the start or end population? Use the population at the start of the period — that is the at-risk group exposed to mortality.
Can the rate exceed 100%? No. If deaths exceed the starting population, your population count is likely wrong or includes animals born during the period; recheck your inputs.