What Is a Burndown Chart Calculator?
A burndown chart is a core Agile and Scrum tool that visualizes how much work remains in a sprint over time. The ideal burndown line is a straight diagonal from the total work at the start down to zero at the end of the sprint. This calculator gives you the exact points on that ideal line so you can compare actual progress against the plan and spot whether your team is ahead or behind schedule.
How to Use It
Enter three numbers: the total work in the sprint (story points or task count), the sprint length in working days, and the current day (0 means the very start). The calculator returns the ideal work remaining on that day, the constant ideal burn rate per day, and how much work should be completed by then.
The Formula Explained
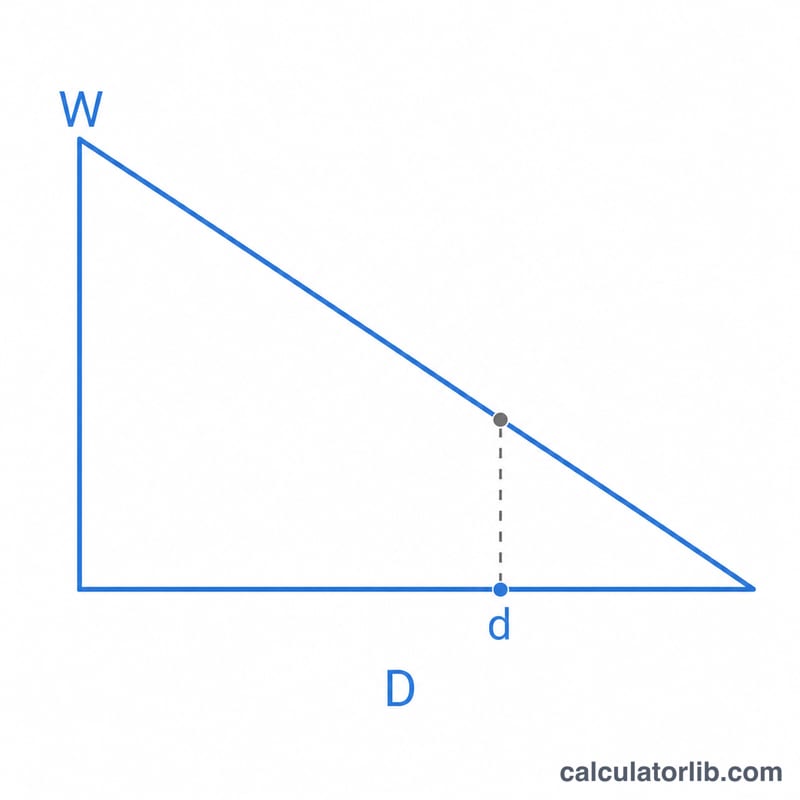
The ideal line assumes work is completed at a constant pace. If total work is \(W\) and the sprint is \(D\) days long, then the ideal burn per day is \(W \div D\). On any day \(d\), the ideal remaining work is:
$$\text{IdealRemaining}(d) = W \times \left(1 - \frac{d}{D}\right)$$
At day 0 this equals \(W\) (nothing done), and at day \(D\) it equals 0 (everything done).
Worked Example
Suppose a team commits to 100 story points over a 10-day sprint. The ideal burn per day is \(100 \div 10 = 10\) points/day. On day 4, the ideal remaining work is $$100 \times \left(1 - \frac{4}{10}\right) = 100 \times 0.6 = 60 \text{ points}.$$ So 40 points should be completed and 60 should remain if the team is exactly on track.
Ideal Burndown Reference Table
The ideal burndown line shows how much work should remain at the end of each day if the team completes an equal share of the total work every day. For a constant daily burn, the ideal remaining work on a given day is:
$$R = \text{Total Work}\left(1 - \frac{\text{Current Day}}{\text{Sprint Length}}\right)$$The table below assumes a standard sprint of 100 story points completed over 10 days. The daily burn rate is \(100 \div 10 = 10\) points per day, so each day the ideal remaining work drops by 10 and the cumulative completed work rises by 10.
| Day | Ideal Remaining (points) | Cumulative Completed (points) |
|---|---|---|
| 0 | 100 | 0 |
| 1 | 90 | 10 |
| 2 | 80 | 20 |
| 3 | 70 | 30 |
| 4 | 60 | 40 |
| 5 | 50 | 50 |
| 6 | 40 | 60 |
| 7 | 30 | 70 |
| 8 | 20 | 80 |
| 9 | 10 | 90 |
| 10 | 0 | 100 |
To adapt the table to your own sprint, recompute the daily burn rate as Total Work ÷ Sprint Length and subtract it once per elapsed day. For example, 60 points over a 6-day sprint also burns 10 points per day, while 120 points over a 10-day sprint burns 12 points per day.
Interpreting Your Burndown Result
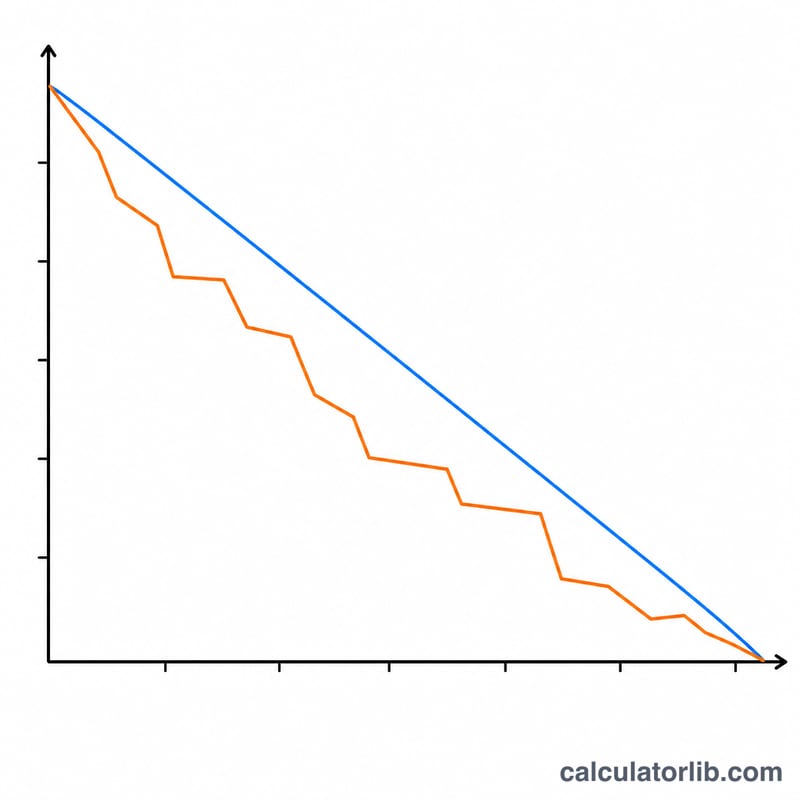
The ideal line is a planning reference, not a forecast. The value of a burndown chart comes from comparing your actual remaining work against the ideal line for the same day.
- Actual above the ideal line (behind schedule): More work remains than the ideal plan predicts. The team is burning down slower than the required rate — common causes are underestimated stories, blockers, unplanned bugs, or interruptions. If the gap widens day over day, the sprint goal is at risk and the team may need to remove scope, swarm on blockers, or adjust expectations.
- Actual below the ideal line (ahead of schedule): Less work remains than planned. The team is completing work faster than the ideal rate. This can mean strong velocity, but it can also signal over-estimated stories or that some work was not fully captured. If consistently early, the team may have capacity to pull in additional backlog items.
- Actual on the ideal line (on track): Remaining work matches the plan for that day. Steady progress toward zero remaining at the end of the sprint. Note that real burndowns are rarely a smooth diagonal — work often clears in steps as stories are finished, so brief deviations around the line are normal.
How scope changes shift the line. The ideal line is anchored to the total work committed at the start of the sprint. When scope is added mid-sprint, total remaining work jumps up and the actual line steps upward, pushing it above the ideal line even if the team is working efficiently. When scope is removed, the actual line drops without any work being completed. Because of this, many teams redraw the ideal line whenever scope changes materially, or track scope changes separately so that progress and scope shifts are not confused. A flat actual line (no downward movement) usually points to blockers or work stuck in review, regardless of scope.
Use the chart to prompt a conversation in standups — the goal is to surface impediments early, not to judge individuals on whether a single day lands exactly on the ideal line.
FAQ
Is the ideal line always straight? Yes — it assumes a constant pace, which is why it forms a straight diagonal. Real burndowns are usually jagged.
What if my current day exceeds the sprint length? The calculator caps the day at the sprint length, so remaining work shows 0.
Can I use tasks instead of story points? Absolutely. Total work can be any countable unit — points, tasks, hours — as long as you stay consistent.