

What is the Accuracy Calculator?
Accuracy is one of the most common metrics for evaluating a classification model. It measures the fraction of all predictions that the model got right — both correct positive predictions and correct negative predictions. This calculator turns the four cells of a confusion matrix into an accuracy score expressed as both a ratio and a percentage.
How to use it
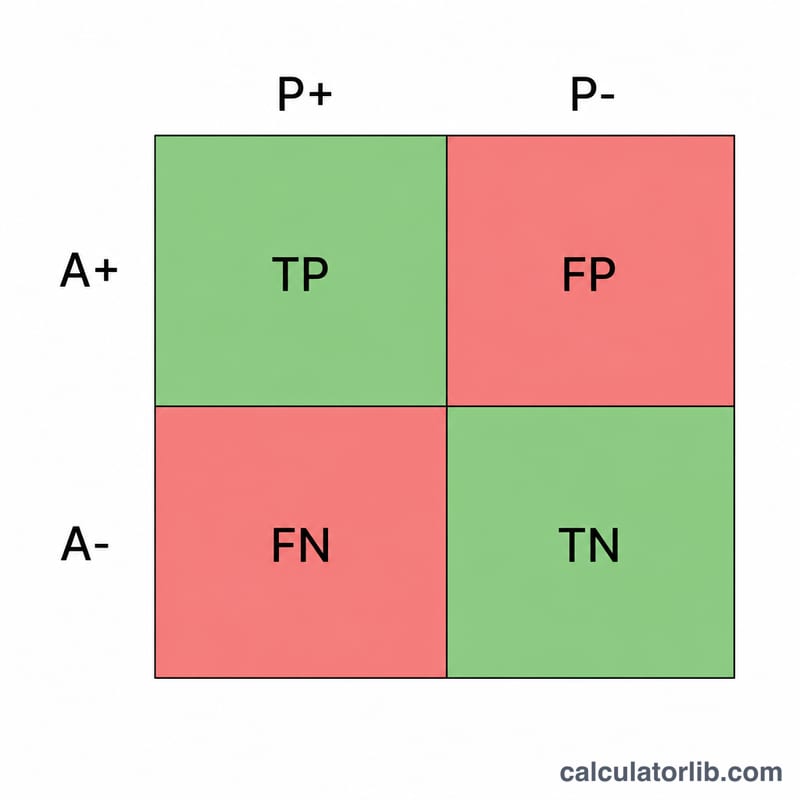
Enter the four counts from your confusion matrix:
- TP (True Positives) — positive cases correctly predicted as positive.
- TN (True Negatives) — negative cases correctly predicted as negative.
- FP (False Positives) — negative cases wrongly predicted as positive.
- FN (False Negatives) — positive cases wrongly predicted as negative.
The calculator returns accuracy automatically. No tool? Just add the four numbers and apply the formula below.
The formula explained
$$\text{Accuracy} = \dfrac{TP + TN}{TP + TN + FP + FN}$$ The numerator counts every correct prediction, while the denominator is the total number of predictions. Multiply by 100 to convert to a percentage.
Worked example
Suppose a model produces \(TP = 80\), \(TN = 70\), \(FP = 20\), \(FN = 30\). Correct predictions = \(80 + 70 = 150\). Total = \(80 + 70 + 20 + 30 = 200\). $$\text{Accuracy} = \dfrac{150}{200} = 0.75$$ or 75%.
Accuracy Across Different Scenarios
The same accuracy formula \(\text{Accuracy} = \frac{\text{TP} + \text{TN}}{\text{TP} + \text{TN} + \text{FP} + \text{FN}} \times 100\%\) can hide very different model behaviour. The scenarios below each use a total of 100 cases so the percentages are directly comparable.
| Scenario | TP | TN | FP | FN | Accuracy |
|---|---|---|---|---|---|
| Balanced dataset, good model | 45 | 45 | 5 | 5 | 90% |
| Imbalanced, majority-negative (rare disease) | 2 | 93 | 2 | 3 | 95% |
| "Always predict negative" baseline | 0 | 95 | 0 | 5 | 95% |
| High false positives (over-flagging) | 48 | 22 | 28 | 2 | 70% |
| High false negatives (missed positives) | 20 | 50 | 0 | 30 | 70% |
The key takeaway is the comparison between the second and third rows: a model that does nothing but predict the majority class scores the same 95% as a model that actually detects some positive cases. On a balanced dataset (row 1) accuracy is far more informative. The last two rows show that two models with identical 70% accuracy can fail in opposite, mutually incompatible ways — one floods you with false alarms, the other quietly misses positives.
Interpreting Your Accuracy Score
Accuracy is the fraction of all predictions the classifier got right — both positives and negatives. An accuracy of 90% means 9 out of every 10 cases were labelled correctly, and the complementary error rate is \(100\% - 90\% = 10\%\). It is intuitive and easy to communicate, which is exactly why it is so often misread.
Always compare to the no-information baseline. The most honest sanity check is the majority-class baseline: the accuracy you would get by always guessing the most common class. If 95% of your cases are negative, a classifier that blindly predicts "negative" every time already scores 95%. A real model must beat that baseline to be worth anything — a 95% accuracy is impressive on a 50/50 split and worthless on a 95/5 split.
When high accuracy is misleading. On strongly imbalanced data, accuracy is dominated by the majority class. A fraud detector, rare-disease screen or defect detector can report 99% accuracy while catching almost none of the rare positive cases that actually matter. In these settings the cost of a false negative and a false positive is usually very different, and a single overall percentage cannot capture that.
Metrics that complement accuracy:
- Precision — of the cases predicted positive, how many really were: \(\text{TP}/(\text{TP}+\text{FP})\). Use it when false positives are costly.
- Recall (sensitivity) — of the actual positives, how many you caught: \(\text{TP}/(\text{TP}+\text{FN})\). Use it when missing a positive is costly.
- Specificity — of the actual negatives, how many you correctly cleared: \(\text{TN}/(\text{TN}+\text{FP})\).
- F1 score — the harmonic mean of precision and recall, a single number balancing the two on the positive class.
- Balanced accuracy — the average of sensitivity and specificity, which corrects for class imbalance and is the better headline figure when classes are skewed.
For the balanced example above (TP=45, FP=5, FN=5), recall and precision are both \(45/50 = 90\%\), so accuracy, precision and recall agree — a sign the dataset is well balanced. When they diverge sharply, trust the per-class metrics over the single accuracy number. This is general technical information, not a substitute for domain-specific evaluation of your particular problem.
Definitions & Glossary
- True Positive (TP)
- A positive case that the model correctly predicted as positive (e.g., a sick patient flagged as sick).
- True Negative (TN)
- A negative case that the model correctly predicted as negative (e.g., a healthy patient cleared as healthy).
- False Positive (FP)
- A negative case wrongly predicted as positive — a false alarm. Also called a Type I error.
- False Negative (FN)
- A positive case wrongly predicted as negative — a miss. Also called a Type II error.
- Confusion matrix
- A 2×2 table cross-tabulating predicted versus actual classes, with TP, TN, FP and FN as its four cells. It is the source of nearly all classification metrics.
- Accuracy
- The proportion of all predictions that are correct: \((\text{TP}+\text{TN})/(\text{TP}+\text{TN}+\text{FP}+\text{FN})\), usually expressed as a percentage.
- Error rate
- The proportion of predictions that are wrong: \((\text{FP}+\text{FN})/(\text{TP}+\text{TN}+\text{FP}+\text{FN}) = 1 - \text{Accuracy}\).
- Precision
- Positive predictive value: \(\text{TP}/(\text{TP}+\text{FP})\) — how trustworthy a positive prediction is.
- Recall
- Sensitivity or true positive rate: \(\text{TP}/(\text{TP}+\text{FN})\) — how many actual positives were found.
- Specificity
- True negative rate: \(\text{TN}/(\text{TN}+\text{FP})\) — how many actual negatives were correctly identified.
- F1 score
- The harmonic mean of precision and recall: \(2 \cdot \frac{\text{precision} \cdot \text{recall}}{\text{precision} + \text{recall}}\), a single balanced measure of positive-class performance.
FAQ
Is accuracy always a good metric? No. On imbalanced datasets (e.g. 95% of cases are negative) a model can score high accuracy by always predicting the majority class. Check precision, recall and F1 too.
What range does accuracy take? Between 0 (every prediction wrong) and 1 (every prediction correct), or 0%–100%.
Does it work for multi-class problems? Yes — treat \(TP + TN\) as the total number of correctly classified samples across all classes and the denominator as the total samples.