
What this calculator does
The Diagnostic Test Accuracy Calculator turns a 2x2 confusion matrix into the standard metrics used in epidemiology and biostatistics: sensitivity, specificity, false negative rate (FNR), false positive rate (FPR), positive predictive value (PPV), negative predictive value (NPV), and prevalence. It is a universal tool — the mathematics is identical anywhere in the world and involves no country-specific rules.
How to use it
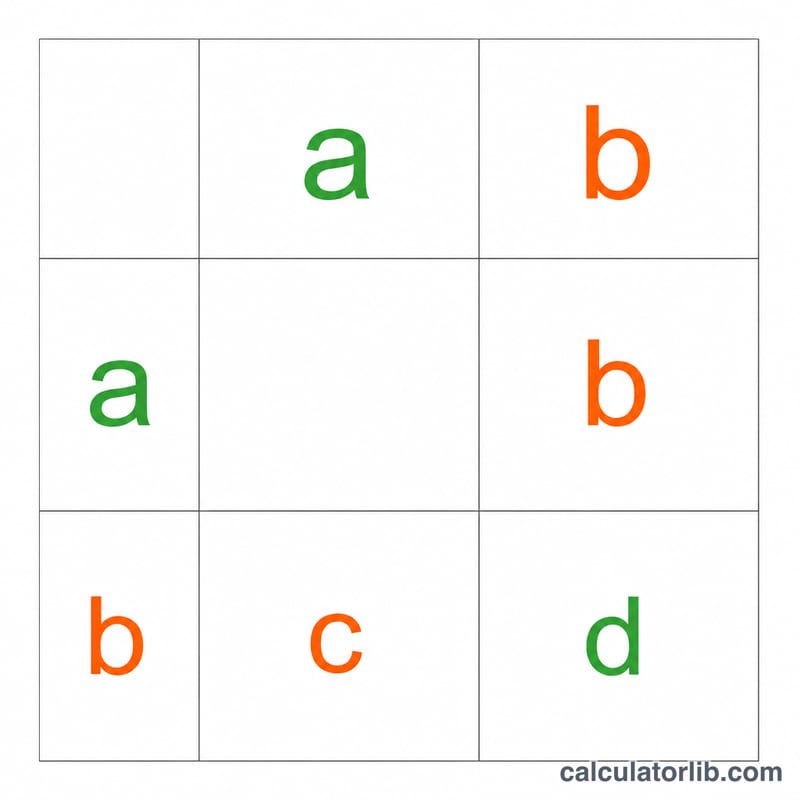
Enter four person counts: the total number of people who actually have the disease, how many of them tested positive, the total number of people without the disease, and how many of them tested negative. From these the calculator derives the four cells of the matrix:
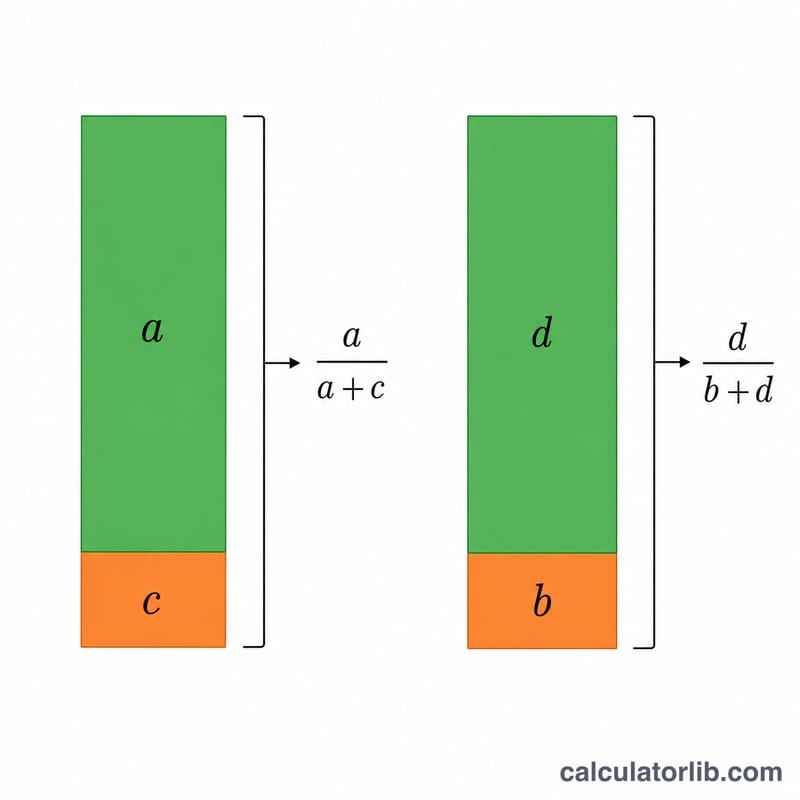
\(a\) (true positives) = diseased who tested positive; \(c\) (false negatives) = diseased total minus \(a\); \(d\) (true negatives) = non-diseased who tested negative; \(b\) (false positives) = non-diseased total minus \(d\).
The formulas explained
$$\text{Sensitivity} = \frac{a}{a + c}$$ measures how well the test detects disease. $$\text{Specificity} = \frac{d}{b + d}$$ measures how well it rules out disease in healthy people. \(\text{FNR} = \frac{c}{a + c} = 1 - \text{sensitivity}\), and \(\text{FPR} = \frac{b}{b + d} = 1 - \text{specificity}\). $$\text{PPV} = \frac{a}{a + b}$$ is the chance you truly have the disease given a positive result, while $$\text{NPV} = \frac{d}{c + d}$$ is the chance you are truly healthy given a negative result. $$\text{Prevalence} = \frac{a + c}{a + b + c + d}$$ is the share of diseased people in the sample and strongly influences PPV and NPV.
Worked example
With 100 diseased people (90 test positive) and 1000 non-diseased people (950 test negative): \(a = 90\), \(c = 10\), \(d = 950\), \(b = 50\). $$\text{Sensitivity} = \frac{90}{100} = 0.9000\ (90\%)$$ $$\text{Specificity} = \frac{950}{1000} = 0.9500\ (95\%)$$ \(\text{FNR} = 0.1000\), \(\text{FPR} = 0.0500\), $$\text{PPV} = \frac{90}{140} = 0.6429\ (64.29\%)$$ $$\text{NPV} = \frac{950}{960} = 0.9896\ (98.96\%)$$ $$\text{Prevalence} = \frac{100}{1100} = 0.0909\ (9.09\%)$$
FAQ
Why is PPV much lower than sensitivity here? Because the disease is rare (low prevalence), even a small false-positive count outweighs true positives, dragging PPV down. PPV and NPV always depend on prevalence.
What is the difference between FNR and FPR? FNR is the fraction of diseased people the test misses; FPR is the fraction of healthy people the test wrongly flags as positive.
What if a category is empty? If there are no diseased people, no non-diseased people, no positive tests or no negative tests, the corresponding ratio is mathematically undefined and is left blank.