What Is the Z-Test Calculator?
The one-sample Z-test compares a sample mean to a known or hypothesized population mean when the population standard deviation (\(\sigma\)) is known and the sample size is reasonably large. This calculator returns the Z-score test statistic along with one-tailed and two-tailed p-values, so you can decide whether to reject your null hypothesis.
How to Use It
Enter four values: the sample mean (\(\bar{x}\)), the hypothesized population mean (\(\mu_0\)), the known population standard deviation (\(\sigma\)), and the sample size (\(n\)). The calculator computes the standard error, the Z-score, and the corresponding probabilities. Compare the p-value to your chosen significance level (commonly \(\alpha = 0.05\)). If the p-value is smaller than \(\alpha\), the result is statistically significant.
The Formula Explained
The Z statistic is $$Z = \frac{\text{Sample Mean} - \text{Population Mean}}{\text{Std Dev} \,/\, \sqrt{\text{Sample Size}}}$$ The denominator, \(\sigma/\sqrt{n}\), is the standard error of the mean — it shrinks as the sample grows, making the test more sensitive. The numerator measures how far the observed mean sits from the hypothesized mean. The resulting Z value is then mapped onto the standard normal distribution to obtain p-values.
Worked Example
Suppose a sample of \(n = 36\) has a mean \(\bar{x} = 105\), the hypothesized mean \(\mu_0 = 100\), and \(\sigma = 15\). The standard error is $$15/\sqrt{36} = 15/6 = 2.5$$ The Z-score is $$(105 - 100)/2.5 = 2.0$$ The two-tailed p-value for \(Z = 2.0\) is approximately \(0.0455\), which is below \(0.05\), so the difference is statistically significant.
FAQ
When should I use a Z-test instead of a t-test? Use a Z-test when the population standard deviation \(\sigma\) is known and/or the sample is large (\(n \geq 30\)). Use a t-test when \(\sigma\) is unknown and estimated from the sample.
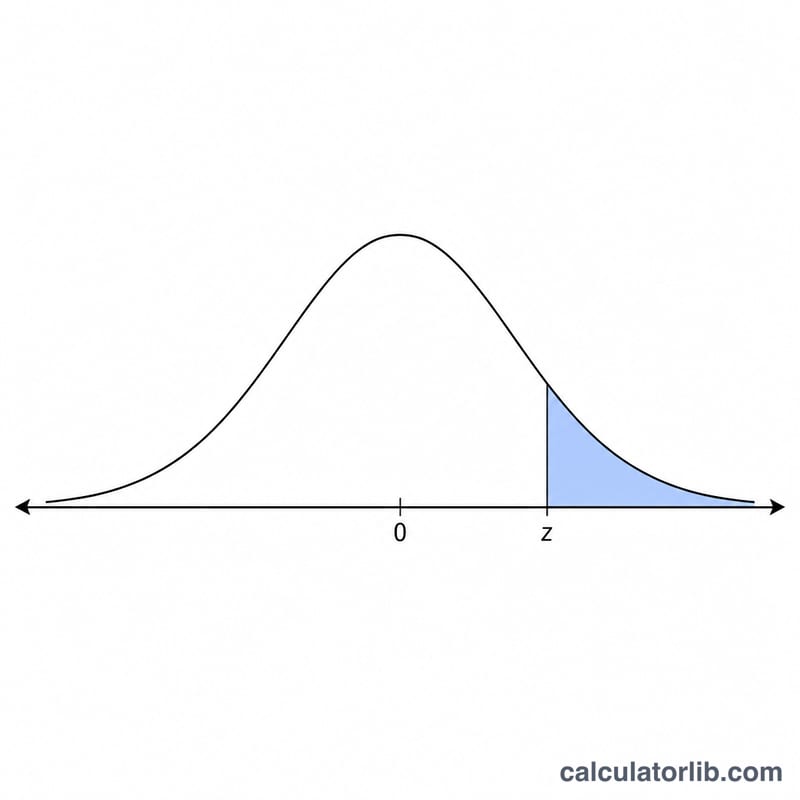
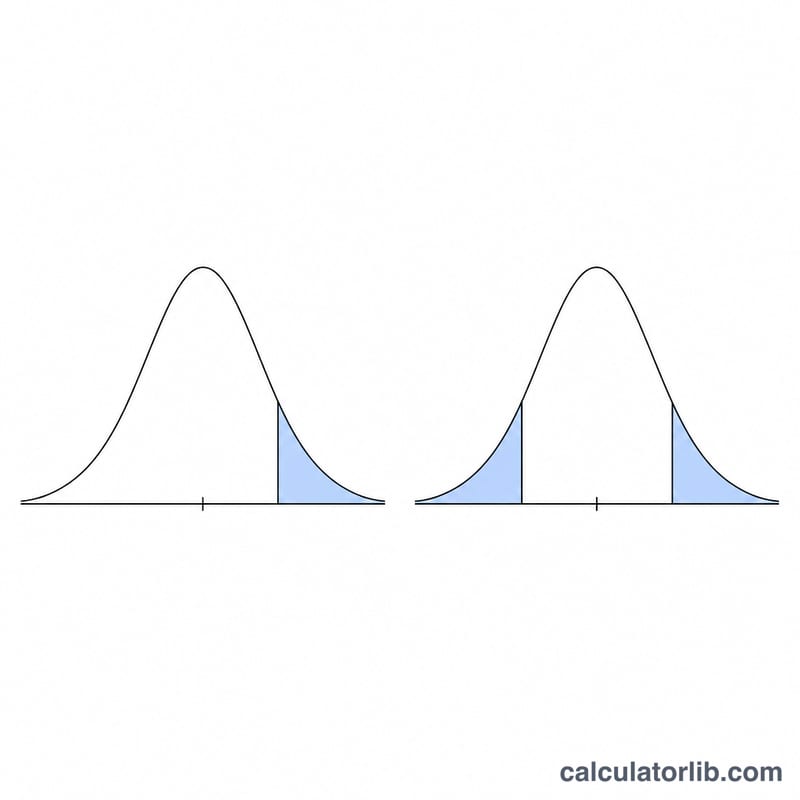
What is the difference between one-tailed and two-tailed p-values? A one-tailed test checks for a difference in a single direction; a two-tailed test checks for any difference and is simply twice the one-tailed value.
How is the p-value computed? This tool uses a high-accuracy numerical approximation of the standard normal cumulative distribution function.


