
What Is a 90% Confidence Interval?
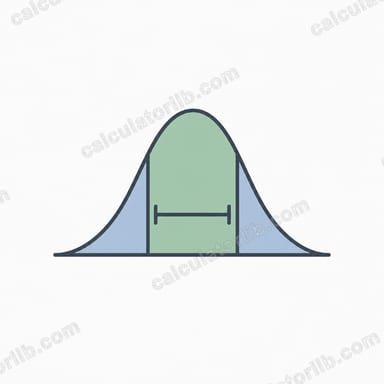
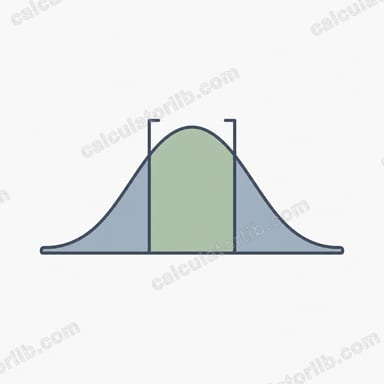
A 90% confidence interval is a range of values, computed from sample data, that is expected to contain the true population mean 90% of the time across repeated sampling. It is wider than the corresponding population estimate would suggest because it accounts for sampling variability. The "90%" refers to the confidence level, which corresponds to a z-critical value of \(1.645\) when using the standard normal (z) distribution.
How to Use This Calculator
Enter three values: the sample mean (x̄), the sample standard deviation (s), and the sample size (n). The calculator computes the standard error, the margin of error, and the resulting lower and upper bounds of your interval. This z-based version assumes a large sample (typically \(n \geq 30\)) or a known population standard deviation. For small samples with unknown variance, a t-interval is more appropriate.
The Formula Explained
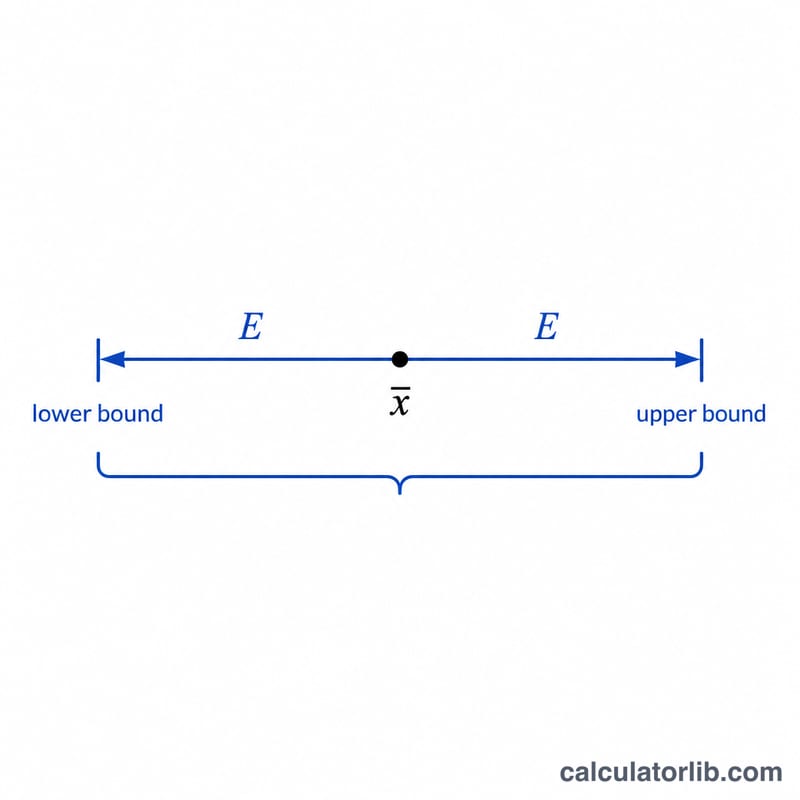
The interval is $$CI = \bar{x} \pm 1.645 \times \dfrac{s}{\sqrt{n}}$$ The term \(s/\sqrt{n}\) is the standard error of the mean — it shrinks as the sample size grows, making the interval tighter. Multiplying by the z-score \(1.645\) gives the margin of error, which is added to and subtracted from the mean to form the bounds.
Worked Example
Suppose \(\bar{x} = 100\), \(s = 15\), and \(n = 30\). The standard error is $$\frac{15}{\sqrt{30}} \approx 2.7386$$ The margin of error is $$1.645 \times 2.7386 \approx 4.5051$$ So the 90% confidence interval is \(100 \pm 4.5051\), or approximately 95.49 to 104.51.
Z-Critical Values for Common Confidence Levels
A confidence interval for a mean (when the population standard deviation is known or the sample is large) takes the form \(\text{CI} = \bar{x} \pm z^* \cdot \frac{s}{\sqrt{n}}\), where \(z^*\) is the two-tailed z-critical value. The critical value depends only on the chosen confidence level: a higher confidence level leaves less probability in the tails and therefore uses a larger \(z^*\).
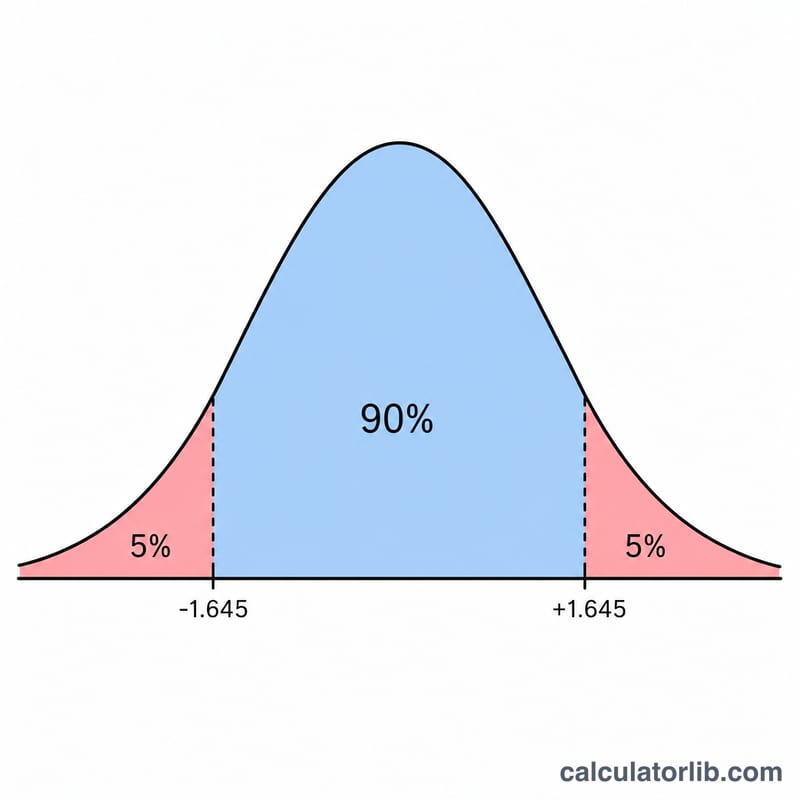
For a 90% interval, the tails together hold \(1 - 0.90 = 0.10\) of the area, split as \(0.05\) per side, which corresponds to \(z^* = 1.645\). The table below lists the standard values.
| Confidence level | Tail area per side (\(\alpha/2\)) | Two-tailed z-critical (\(z^*\)) |
|---|---|---|
| 80% | 0.100 | 1.282 |
| 90% | 0.050 | 1.645 |
| 95% | 0.025 | 1.960 |
| 98% | 0.010 | 2.326 |
| 99% | 0.005 | 2.576 |
If you need a different level for the same data, you can re-run the calculation with the 95% interval or 99% interval tools, which use \(z^* = 1.960\) and \(2.576\) respectively.
Interpreting Your Confidence Interval
Under the standard (frequentist) definition, a 90% confidence interval describes a procedure, not a single interval. If you were to draw many independent random samples and build a 90% interval from each one, about 90% of those intervals would contain the true population mean. The 90% is the long-run coverage rate of the method.
It is therefore not correct to say "there is a 90% probability the true mean lies inside this particular interval." Once your data are collected, the bounds are fixed numbers and the true mean either is or is not inside them — the probability statement applies to the repeated procedure, not to the one interval in front of you.
To report a result, state the point estimate, the interval, and the level — for example: "the sample mean was 100, 90% CI [97.00, 103.00]." You can equivalently write it as estimate \(\pm\) margin of error, e.g. \(100 \pm 3.00\).
- A narrower interval signals a more precise estimate. It results from a larger sample size, lower variability in the data, or a lower confidence level.
- A wider interval reflects more uncertainty — from a small sample, highly variable data, or demanding a higher confidence level such as 95% or 99%.
Choosing a higher confidence level (using a larger \(z^*\)) widens the interval for the same data: you trade precision for greater assurance of coverage. Compare the same sample at the 95% level to see this trade-off. Note also that the z-based interval assumes a known standard deviation or a large sample; for small samples with an estimated standard deviation, a t-distribution critical value is more appropriate.
FAQ
Why is the z-score 1.645? It is the value that leaves 5% in each tail of the standard normal distribution (10% total), corresponding to 90% in the middle.
Should I use z or t? Use z (\(1.645\)) for large samples or known population standard deviation. For small samples with an estimated standard deviation, use a t-distribution with \(n-1\) degrees of freedom.
How do I make the interval narrower? Increase the sample size or reduce variability. A larger \(n\) shrinks the standard error and tightens the interval.