
What This Calculator Does
This tool estimates a confidence interval (CI) for the difference between two independent population proportions. You supply the number of successes and the sample size for two groups, choose a confidence level (90%, 95%, or 99%), and the calculator returns the lower and upper bounds of the interval along with the sample proportions, standard error, z-score, and margin of error. It is a universal statistical method with no country or jurisdiction restrictions.
How to Use It
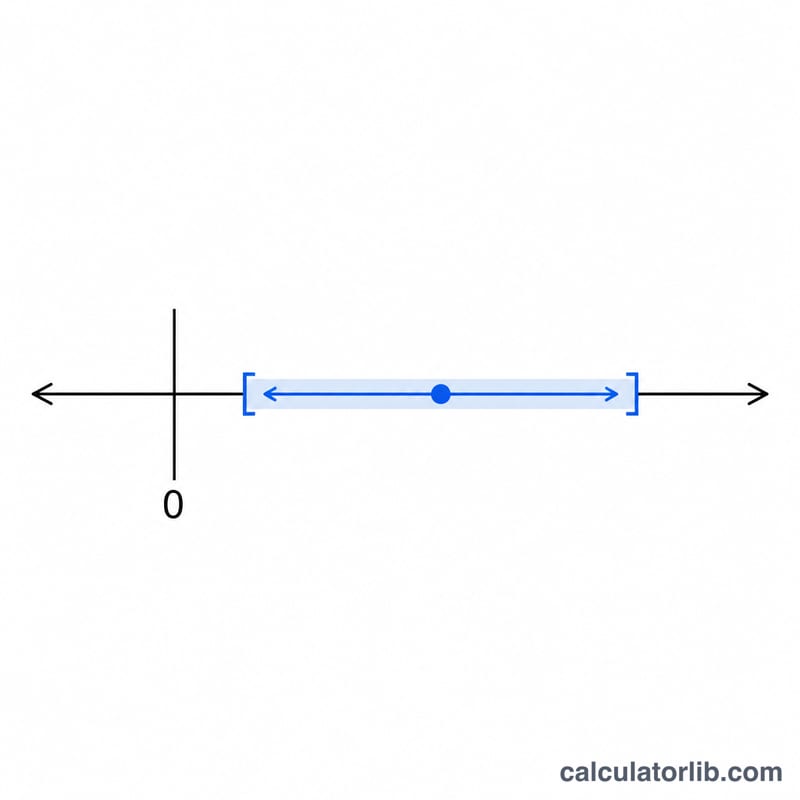
Enter x₁ (successes in group 1) and n₁ (sample size of group 1), then x₂ and n₂ for group 2. Pick your confidence level and read the interval. If the interval contains 0, the difference between the two proportions is not statistically significant at that level. If it lies entirely above or below 0, one proportion is significantly larger than the other.
The Formula Explained
The sample proportions are \(\hat{p}_1 = x_1/n_1\) and \(\hat{p}_2 = x_2/n_2\). The standard error combines the variance of each estimate: $$\text{SE} = \sqrt{\frac{\hat{p}_1(1-\hat{p}_1)}{n_1} + \frac{\hat{p}_2(1-\hat{p}_2)}{n_2}}$$ The interval is then $$\left(\hat{p}_1 - \hat{p}_2\right) \pm z \cdot \text{SE}$$ where \(z\) is the critical value (1.645 for 90%, 1.960 for 95%, 2.576 for 99%). This is the Wald (normal approximation) method, which works well when each group has at least about 10 successes and 10 failures.
Worked Example
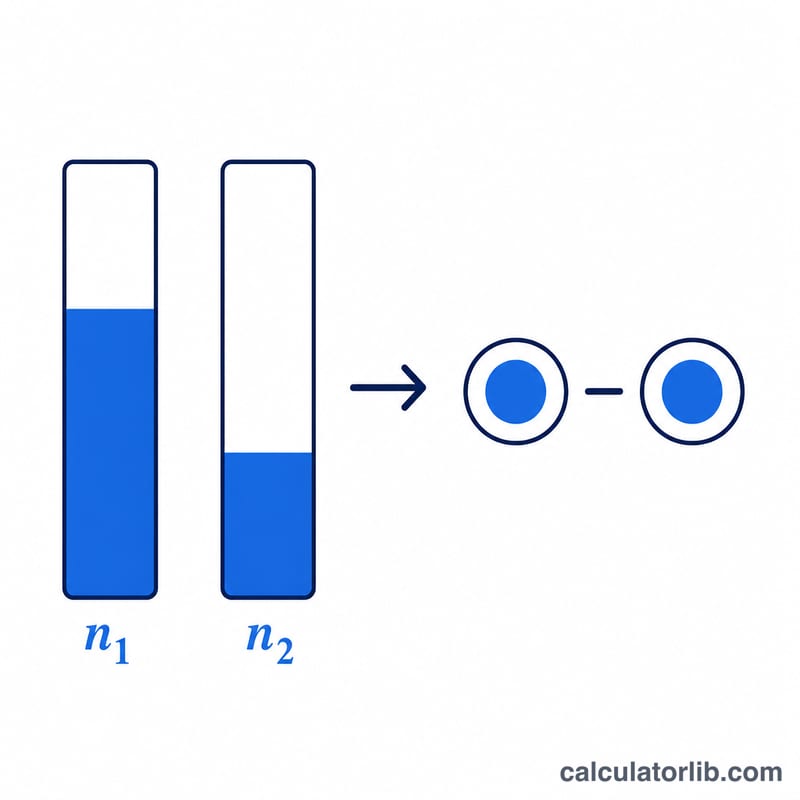
Suppose group 1 has 40 successes out of 100 (\(\hat{p}_1 = 0.40\)) and group 2 has 30 out of 100 (\(\hat{p}_2 = 0.30\)). The difference is 0.10. $$\text{SE} = \sqrt{\frac{0.40\cdot 0.60}{100} + \frac{0.30\cdot 0.70}{100}} = \sqrt{0.0024 + 0.0021} = \sqrt{0.0045} \approx 0.06708$$ At 95%, $$\text{margin} = 1.95996 \times 0.06708 \approx 0.13148$$ The CI is about \(0.10 \pm 0.131\), or roughly \((-0.0315,\ 0.2315)\). Because it includes 0, the difference is not significant at 95%.
FAQ
When is the normal approximation valid? A common rule is at least 10 successes and 10 failures in each group; for very small samples consider exact methods.
What does it mean if the interval includes 0? There is no statistically significant difference between the two proportions at the chosen confidence level.
Can the proportions exceed the [−1, 1] range? The difference always lies between −1 and 1, but the Wald interval bounds can theoretically extend slightly past plausible values with extreme inputs.