
What Is a 99% Confidence Interval?
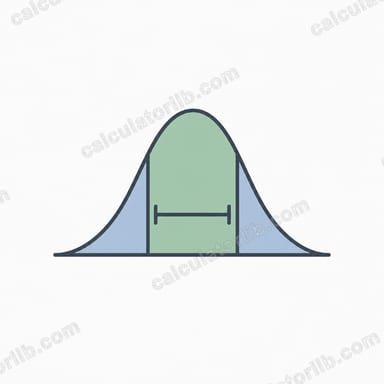
A 99% confidence interval is a range of values that is likely to contain the true population mean with 99% confidence. It is calculated from a sample mean, the sample standard deviation, and the sample size. The wider the interval, the more confident you can be that it captures the real average — and a 99% level produces a wider interval than the more common 95% level.
How to Use This Calculator
Enter three values: your sample mean (\(\bar{x}\)), your sample standard deviation (\(s\)), and your sample size (\(n\)). The calculator computes the standard error, the margin of error, and the lower and upper bounds of the 99% confidence interval. It assumes a normal (z) distribution, which is appropriate when \(n\) is reasonably large (typically \(n \geq 30\)).
The Formula Explained
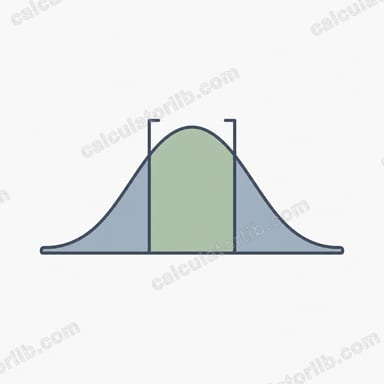
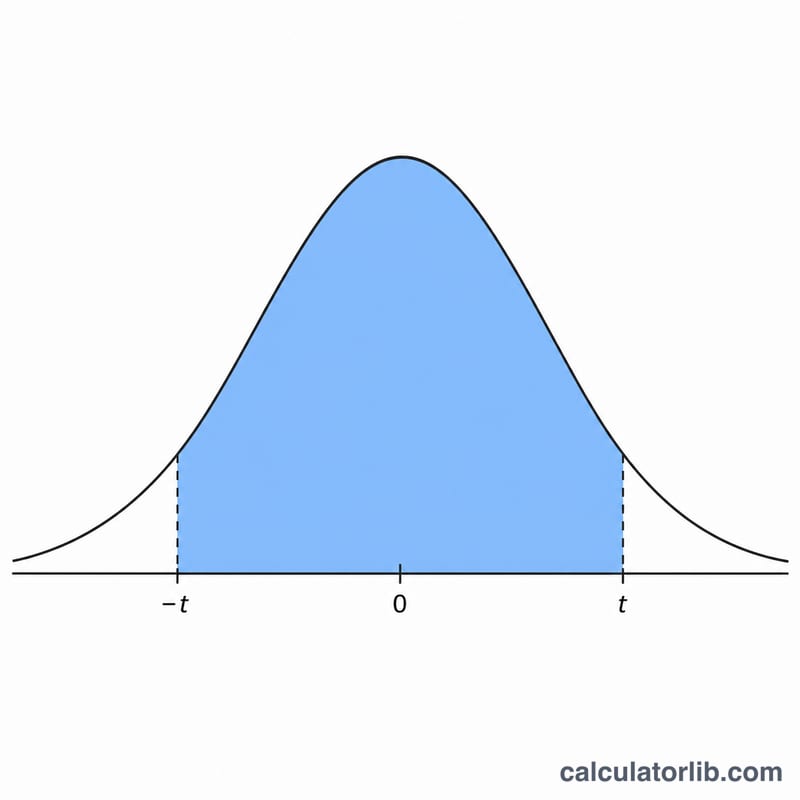
The formula is $$CI = \bar{x} \pm 2.576 \times \dfrac{s}{\sqrt{n}}$$ The value 2.576 is the z-score that leaves 0.5% of the distribution in each tail, capturing the central 99%. The term \(\dfrac{s}{\sqrt{n}}\) is the standard error, which shrinks as your sample grows — meaning larger samples give tighter, more precise intervals.
Worked Example
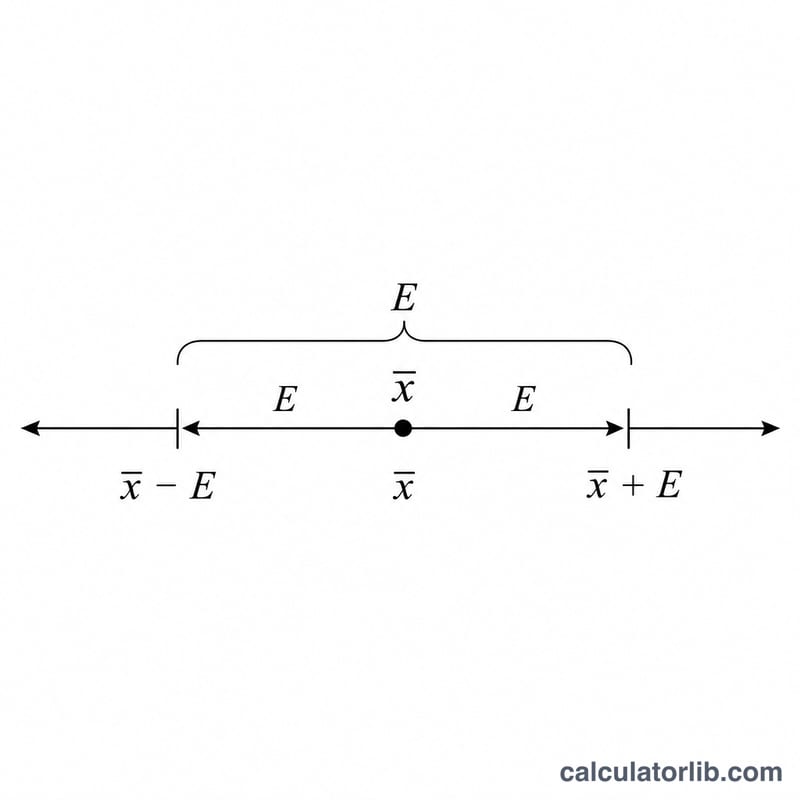
Suppose \(\bar{x} = 100\), \(s = 15\), and \(n = 30\). The standard error is $$SE = \frac{15}{\sqrt{30}} = \frac{15}{5.4772} \approx 2.7386$$ The margin of error is $$2.576 \times 2.7386 \approx 7.0547$$ So the 99% confidence interval is \(100 \pm 7.05\), or approximately 92.95 to 107.05.
Z-Scores for Common Confidence Levels
A confidence interval for a mean uses a critical z-score that depends on the chosen confidence level. The higher the confidence, the larger the z-score and the wider the interval. The values below are two-tailed critical values from the standard normal distribution, with the corresponding area left in each tail.
| Confidence Level | Two-Tailed Z-Score | Tail Area Per Side |
|---|---|---|
| 80% | 1.282 | 0.100 |
| 90% | 1.645 | 0.050 |
| 95% | 1.960 | 0.025 |
| 98% | 2.326 | 0.010 |
| 99% | 2.576 | 0.005 |
| 99.9% | 3.291 | 0.0005 |
For a 99% interval, the total tail area is \(1 - 0.99 = 0.01\), split into \(0.005\) on each side. The z-score that leaves 0.005 in the upper tail is approximately 2.576, which is why this calculator multiplies the standard error by 2.576.
Interpreting Your Confidence Interval
A 99% confidence interval is a statement about a long-run procedure, not about a single result. If you were to repeatedly draw random samples and build a 99% interval from each, about 99% of those intervals would contain the true population mean. It is not correct to say there is a 99% probability that the true mean lies inside your one specific interval — for a given computed interval the true mean either is or is not inside it, and the 99% describes the reliability of the method across many samples.
Valid interpretation depends on a few assumptions:
- Random sampling: the data should be a random, independent sample from the population of interest. Biased or convenience samples can produce intervals that systematically miss the true mean.
- Approximate normality: the sampling distribution of the mean should be roughly normal. With large samples this holds by the Central Limit Theorem even if the raw data are skewed; with small samples it relies more heavily on the underlying data being approximately normal.
- Known or large-sample standard deviation: using the z-score 2.576 assumes the standard deviation is known or that the sample is large enough that the normal approximation is adequate. For small samples with an estimated standard deviation, a t-based interval is more accurate.
Finally, the interval estimates the population mean, not the spread of individual values. A 99% confidence interval of 96.14 to 103.86 says where the average is likely to fall — it does not mean 99% of individual observations lie in that range. To describe individual values you would need a prediction or tolerance interval instead.
FAQ
Why is 2.576 used? It is the critical z-value for a two-tailed 99% confidence level under the standard normal distribution.
When should I use the t-distribution instead? When your sample is small (\(n < 30\)) and the population standard deviation is unknown, a t-score gives a more accurate interval.
Does a wider interval mean less accuracy? No — a wider interval reflects greater confidence. A 99% interval is wider than a 95% interval because it must be more certain to include the true mean.