

What this calculator does
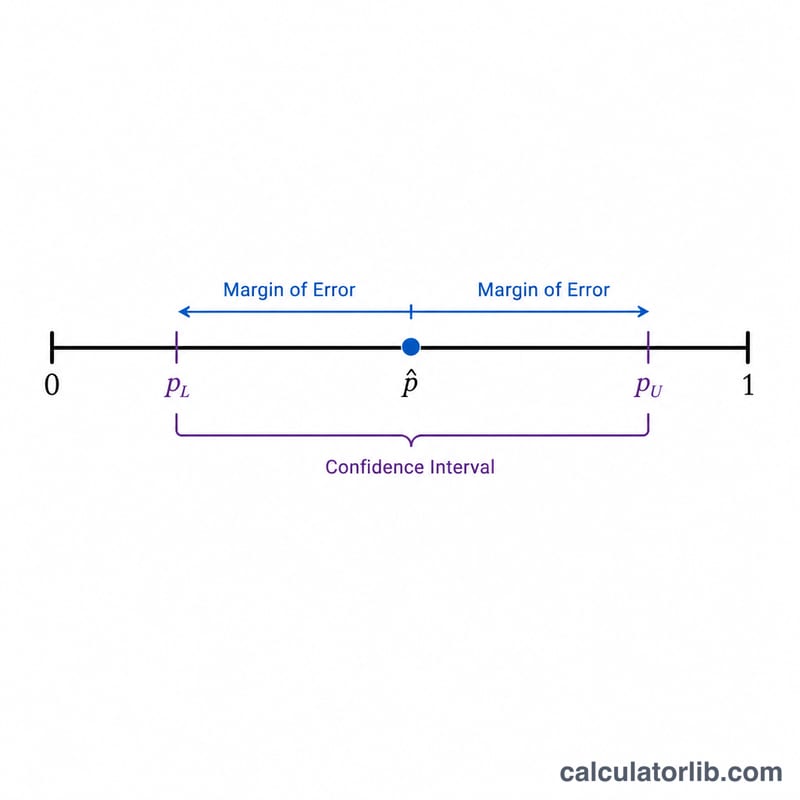
This tool computes a confidence interval for a population proportion from the number of successes and the total sample size. It uses the normal (Wald) approximation, the most common method taught in introductory statistics, and reports the interval at your chosen confidence level (90%, 95%, or 99%).
How to use it
Enter the number of successes (x) — for example, the number of people who answered "yes" — and the sample size (n). Pick a confidence level and the calculator returns the sample proportion, standard error, margin of error, and the lower and upper bounds of the interval.
The formula explained
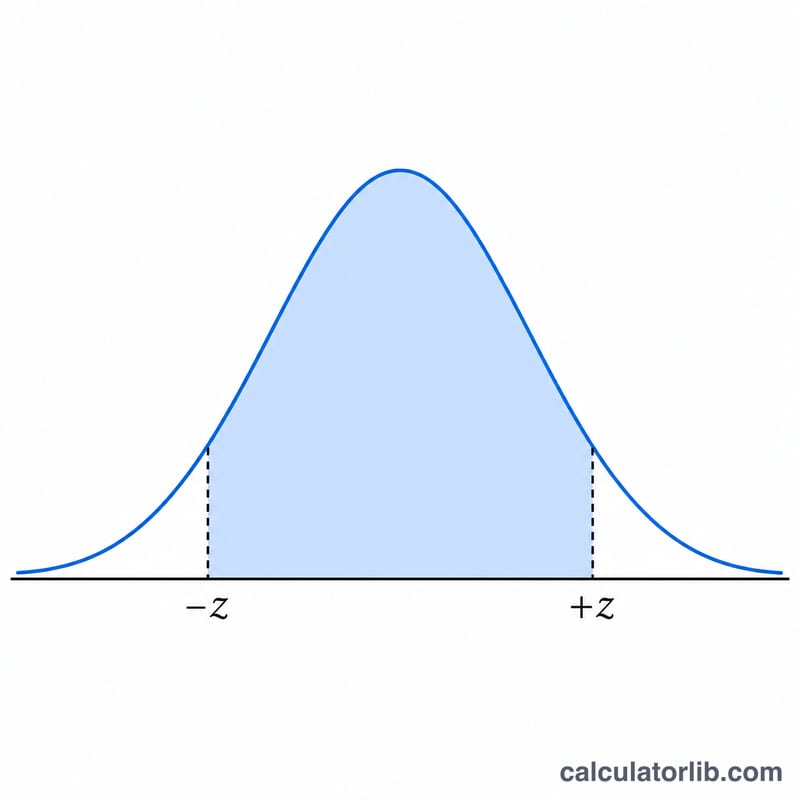
The sample proportion is \(\hat{p} = x/n\). The standard error is \(SE = \sqrt{\hat{p}(1-\hat{p})/n}\). Multiply SE by the critical z-value (1.645 for 90%, 1.96 for 95%, 2.576 for 99%) to get the margin of error, then add and subtract it from \(\hat{p}\):
$$CI = \hat{p} \pm z \cdot SE$$
Worked example
Suppose 80 out of 100 sampled customers are satisfied. Then \(\hat{p} = 0.80\) and $$SE = \sqrt{0.80 \times 0.20 / 100} = \sqrt{0.0016} = 0.04.$$ At 95% confidence, margin = \(1.96 \times 0.04 = 0.0784\). The interval is \(0.80 \pm 0.0784 = (0.7216, 0.8784)\), or about 72.16% to 87.84%.
FAQ
What does a 95% confidence interval mean? If you repeated the sampling many times, about 95% of the intervals built this way would contain the true population proportion.
When is the Wald method valid? It works well when both \(n\hat{p}\) and \(n(1-\hat{p})\) are at least about 5–10. For very small samples or proportions near 0 or 1, consider the Wilson or Clopper–Pearson interval.
Why is my interval clipped at 0 or 1? A proportion cannot be below 0 or above 1, so bounds outside that range are truncated.