
What Is a 95% Confidence Interval?
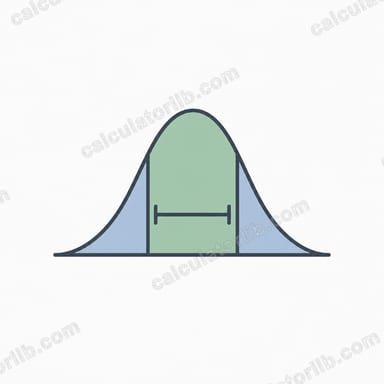
A 95% confidence interval is a range of values, calculated from sample data, that is likely to contain the true population mean. "95% confidence" means that if you repeated your sampling process many times, about 95% of the intervals you construct would capture the real mean. It is one of the most widely reported statistics in science, surveys, medicine, and business analytics.
How to Use This Calculator
Enter three values: the sample mean (\(\bar{x}\)), the sample standard deviation (\(s\)), and the sample size (\(n\)). The calculator returns the lower and upper bounds of the interval along with the standard error and margin of error so you can see exactly how the result was built.
The Formula Explained
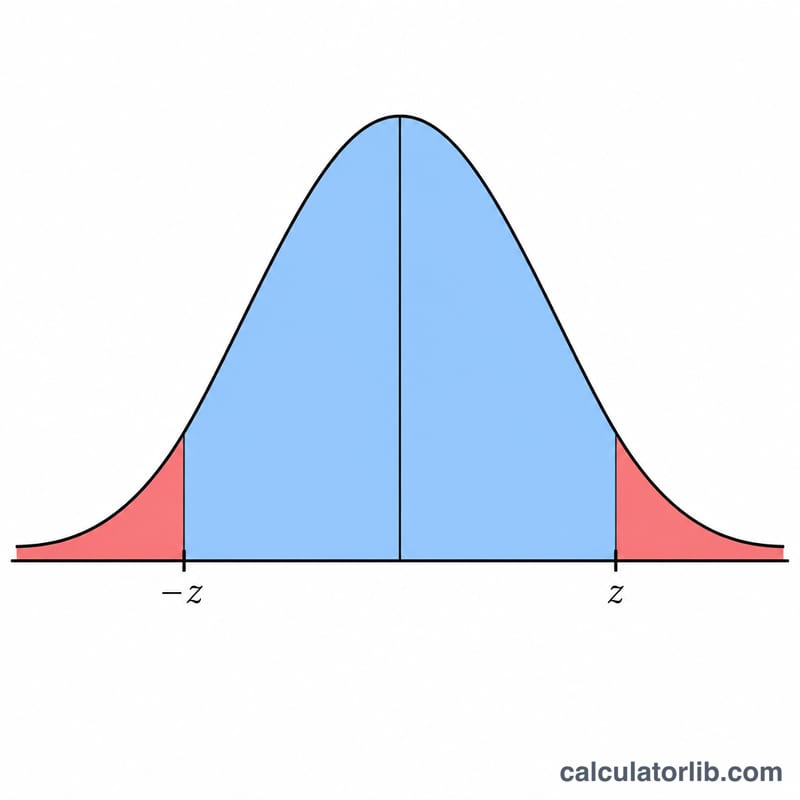
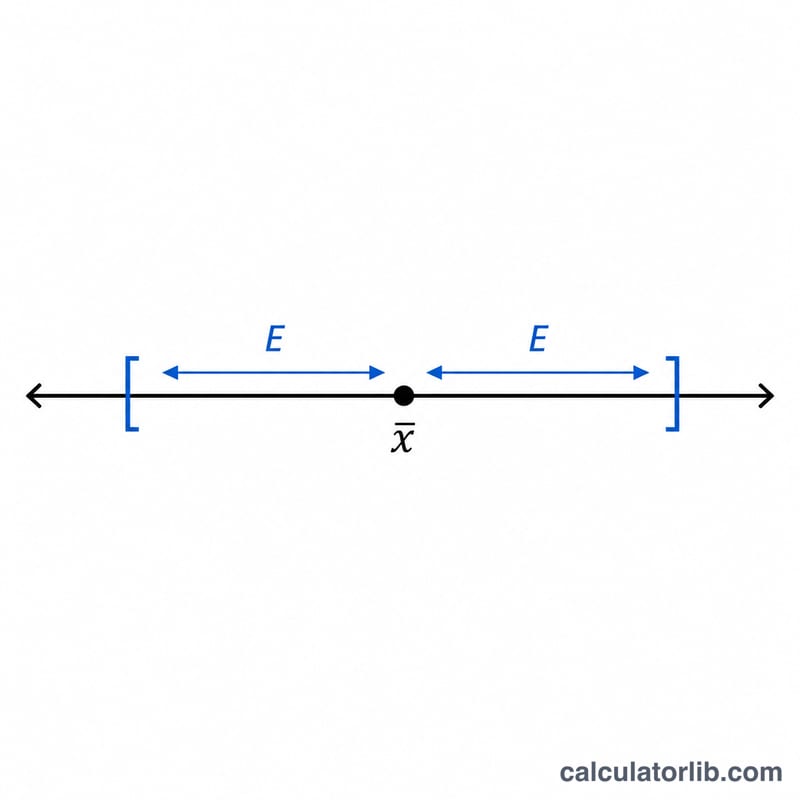
The interval is computed as $$CI = \bar{x} \pm 1.96 \cdot \dfrac{s}{\sqrt{n}}$$ The term \(s / \sqrt{n}\) is the standard error of the mean — it shrinks as your sample grows, making the estimate more precise. The constant 1.96 is the z-score that captures the central 95% of a standard normal distribution. Multiplying the standard error by 1.96 gives the margin of error, which is added and subtracted from the mean.
Worked Example
Suppose a sample has a mean of 100, a standard deviation of 15, and 36 observations. The standard error is $$15 / \sqrt{36} = 15 / 6 = 2.5$$ The margin of error is $$1.96 \times 2.5 = 4.9$$ The 95% confidence interval is therefore \(100 \pm 4.9\), or 95.1 to 104.9.
Z-Scores for Common Confidence Levels
A confidence interval for a mean uses a critical value (z-score) drawn from the standard normal distribution. For a two-tailed interval, the chosen confidence level leaves a combined tail area of \(\alpha = 1 - \text{CL}\), split evenly into each tail (\(\alpha/2\)). The 95% interval — the one this calculator computes — uses the familiar value \(z = 1.960\), which leaves 2.5% in each tail.
| Confidence level | Two-tailed z-score | Total tail area (\(\alpha\)) | Area in each tail (\(\alpha/2\)) |
|---|---|---|---|
| 80% | 1.282 | 0.20 | 0.100 |
| 90% | 1.645 | 0.10 | 0.050 |
| 95% | 1.960 | 0.05 | 0.025 |
| 98% | 2.326 | 0.02 | 0.010 |
| 99% | 2.576 | 0.01 | 0.005 |
These z-scores assume the population standard deviation is known or the sample is large enough that the normal approximation holds. For small samples with an estimated standard deviation, a t-distribution critical value (which is larger) is more appropriate.
FAQ
Why 1.96 and not 2? 1.96 is the precise z-value for 95% confidence in a normal distribution. The rounded value 2 is a quick approximation.
Should I use the z or t distribution? The z-score (1.96) is appropriate for large samples or when the population standard deviation is known. For small samples (n < 30) with unknown population SD, a t-distribution gives a slightly wider, more accurate interval.
What does a wider interval mean? A wider interval reflects more uncertainty — usually from a small sample or large variability. Larger samples produce narrower, more precise intervals.