
What this calculator does
This tool builds a confidence interval for a population mean from sample data. When the population standard deviation is unknown — which is almost always the case in practice — the correct approach uses the Student-t distribution rather than the normal (z) distribution. The interval gives you a plausible range for the true mean at your chosen confidence level.
How to use it
Enter the sample mean (\(\bar{x}\)), the sample standard deviation (\(s\)), the sample size (\(n\)), and pick a confidence level of 90%, 95%, or 99%. The calculator returns the lower and upper bounds, the margin of error, the critical t value, the standard error, and the degrees of freedom (\(n - 1\)).
The formula explained
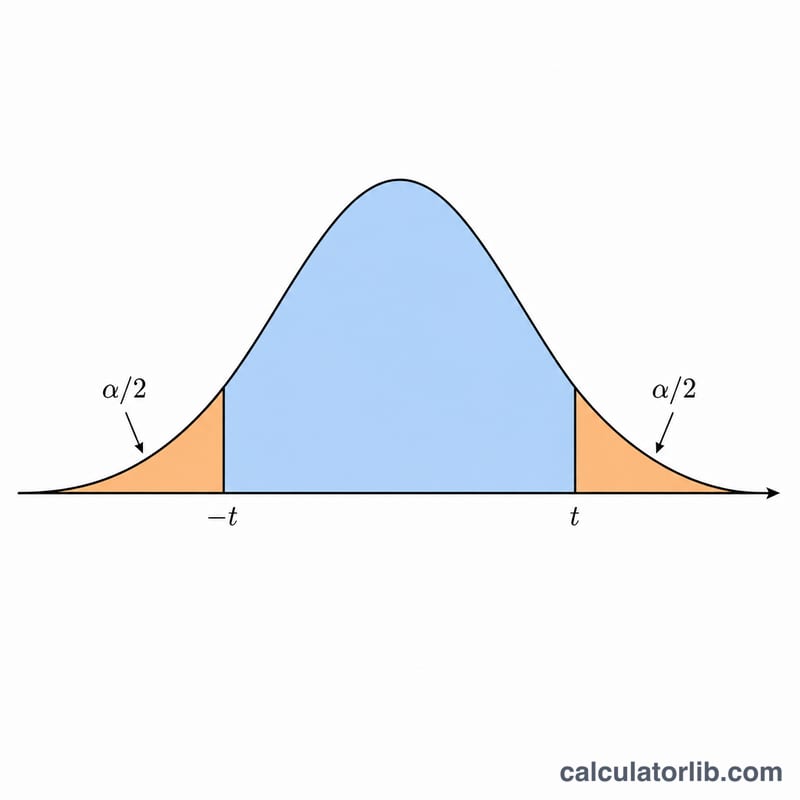
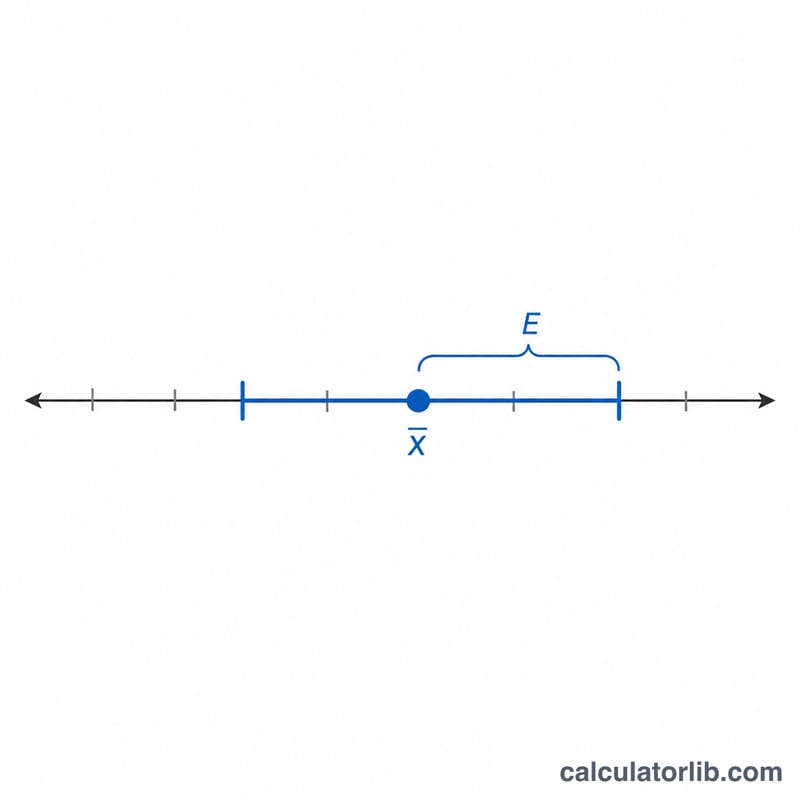
The interval is $$\text{CI} = \bar{x} \pm t_{\alpha/2,\,df}\cdot\frac{s}{\sqrt{n}}$$ Here \(s/\sqrt{n}\) is the standard error of the mean, which measures how much the sample mean is expected to vary from the true mean. The critical value \(t\) depends on the degrees of freedom (\(n - 1\)) and the chosen confidence level. Multiplying the standard error by \(t\) gives the margin of error, which is added to and subtracted from the sample mean.
Worked example
Suppose \(\bar{x} = 100\), \(s = 15\), \(n = 30\), at 95% confidence. The standard error is $$\frac{15}{\sqrt{30}} \approx 2.7386$$ With 29 degrees of freedom the critical \(t \approx 2.0452\), so the margin of error is about \(5.601\). The 95% confidence interval is roughly \(94.40\) to \(105.60\).
FAQ
When should I use t instead of z? Use the t distribution whenever the population standard deviation is unknown and you estimate it from the sample — true for most real datasets. For large \(n\) the t and z values nearly coincide.
What does 95% confidence mean? If you repeated the sampling many times and built an interval each time, about 95% of those intervals would contain the true population mean.
Does this assume normal data? The t interval assumes the data are approximately normal or the sample is large enough for the central limit theorem to apply.