
What is a Binomial Confidence Interval?
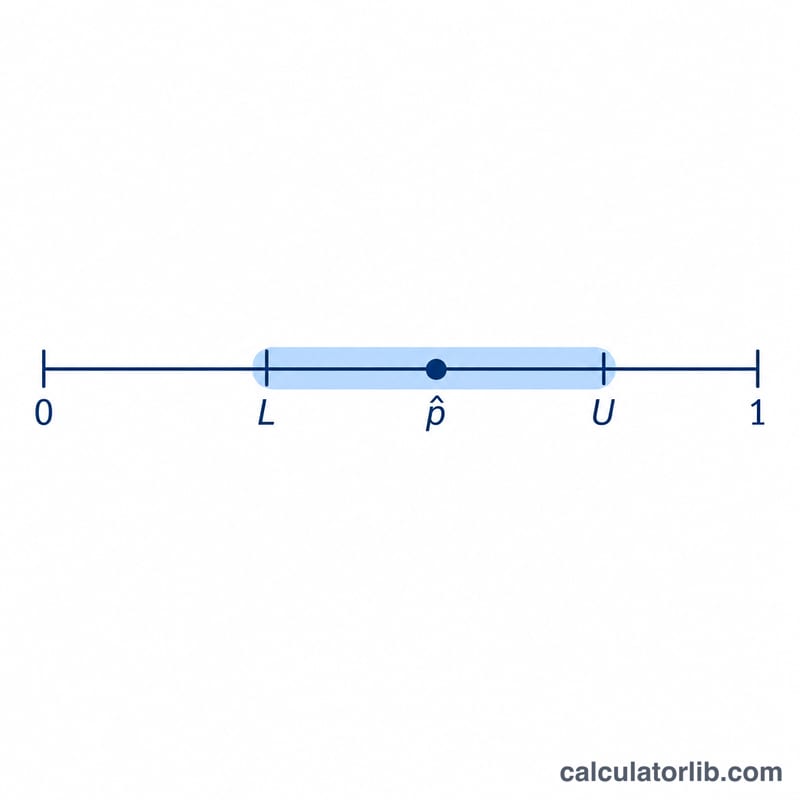
When you observe a number of successes (x) out of a number of trials (n), the sample proportion \(\hat{p} = x/n\) estimates the true underlying probability of success. A confidence interval gives a range that is likely to contain that true proportion. This calculator uses the Wilson score interval, which is more accurate than the classic Wald (normal approximation) interval, especially for small samples or proportions near 0 or 1.
How to Use It
Enter the number of successes, the total number of trials, and select your confidence level (90%, 95% or 99%). The calculator returns the lower and upper bounds of the interval as percentages, along with the sample proportion, the interval center, the margin (half-width) and the z-score used.
The Formula Explained
The Wilson score interval centers the estimate on a slightly adjusted proportion and shrinks the width toward 0.5 for small samples:
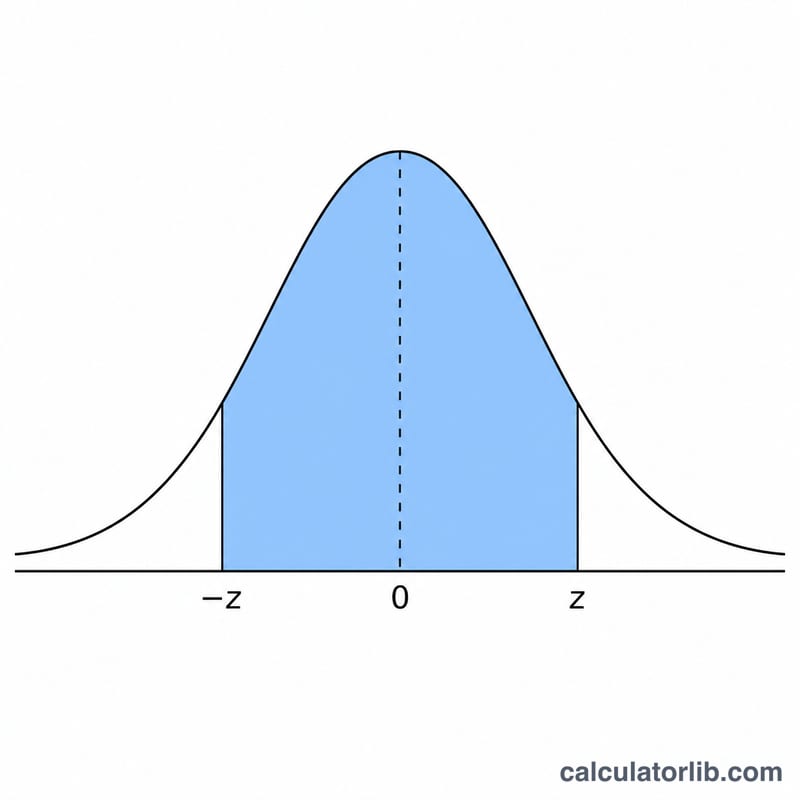
$$\text{CI} = \frac{\hat{p} + \dfrac{z^{2}}{2n} \pm z\sqrt{\dfrac{\hat{p}(1-\hat{p})}{n} + \dfrac{z^{2}}{4n^{2}}}}{1 + \dfrac{z^{2}}{n}}$$Here \(z\) is the standard normal critical value: 1.6449 for 90%, 1.9600 for 95%, and 2.5758 for 99%.
Worked Example
Suppose 40 successes out of 100 trials at 95% confidence. Then \(\hat{p} = 0.40\), \(z = 1.95996\), \(z^{2} = 3.8415\). The denominator is \(1 + 3.8415/100 = 1.038415\). The center is $$(0.40 + 3.8415/200)/1.038415 = 0.41763/1.038415 = 0.40218.$$ The margin is $$1.95996\cdot\sqrt{0.40\cdot0.60/100 + 3.8415/40000}/1.038415 = 1.95996\cdot\sqrt{0.00249604}/1.038415 = 0.09666.$$ So the interval is about 30.55% to 49.88%.
Z-Critical Values by Confidence Level
The Wilson score interval uses a two-sided critical value \(z\) from the standard normal distribution. For a confidence level \(C\), the value is \(z = z_{1-\alpha/2}\) where \(\alpha = 1 - C\), so that the central area equals \(C\) and each tail holds \(\alpha/2\). The most commonly used values are listed below.
| Confidence level | Tail area \(\alpha/2\) | Two-sided \(z\) |
|---|---|---|
| 80% | 0.100 | 1.2816 |
| 90% | 0.050 | 1.6449 |
| 95% | 0.025 | 1.9600 |
| 98% | 0.010 | 2.3263 |
| 99% | 0.005 | 2.5758 |
| 99.9% | 0.0005 | 3.2905 |
These are two-sided values: the same \(z\) is used for both the lower and upper Wilson bounds. A higher confidence level corresponds to a larger \(z\), which widens the interval. This calculator offers the three most common selections — 90% (1.6449), 95% (1.9600) and 99% (2.5758).
Interpreting Your Confidence Interval
A 95% confidence level describes the long-run performance of the procedure, not a probability about your single interval. If you repeated the same sampling and computed a Wilson interval each time, about 95% of those intervals would contain the true population proportion \(p\). For the one interval you actually computed, the true \(p\) is either inside it or not; the 95% is a property of the method across many hypothetical samples, not the chance that this specific interval captured \(p\).
The width of the interval reflects precision. A narrow interval indicates the estimate is tightly determined — typically the result of a large number of trials. A wide interval indicates greater uncertainty, common with small samples or proportions near 0.5, where binomial variability is largest. Comparing two groups, an interval that is much wider signals that its estimate should be treated as less precise.
When a bound touches 0 or 1, it means the data are consistent with proportions all the way down to 0 (or up to 1). This often occurs when the observed count is at an extreme — for example 0 successes gives a lower bound of exactly 0, and all observed successes gives an upper bound of exactly 1. The opposite bound still carries information: a \(0/20\) result rules out high proportions even though the lower bound is 0. The Wilson interval is constructed to stay within the valid \([0, 1]\) range, so such touching bounds are expected behavior rather than an error.
This is general statistical information and not professional advice for any specific analysis.
FAQ
Why Wilson instead of Wald? The Wald interval can extend below 0 or above 1 and under-covers for small n; Wilson stays within [0,1] and has better coverage.
What confidence level should I use? 95% is the most common default; use 99% when you need higher certainty (wider interval) or 90% for a narrower one.
Does it work for proportions of 0 or 100%? Yes — Wilson produces sensible, non-degenerate bounds even when x = 0 or x = n.