
What This Confidence Interval Calculator Does
A confidence interval gives you a range of values that likely contains the true population mean, based on a single sample. This calculator takes your sample statistics and returns a lower bound, an upper bound, and the margin of error — so you can report results like "the true average is between X and Y, with 95% confidence." It uses the z-distribution (normal distribution), which is the standard approach when the sample is reasonably large or the population standard deviation is known.
The Inputs You Provide
- Sample Mean — the average of your sample data (the centre of your interval).
- Standard Deviation — how spread out your sample values are.
- Sample Size — the number of observations in your sample.
- Confidence Level — how sure you want to be, typically 90%, 95%, or 99%.
The Formula
The calculator works through these steps:
- Standard Error = Standard Deviation ÷ √(Sample Size)
- Z-score = the critical value from the normal distribution for your confidence level (e.g. 1.645 for 90%, 1.96 for 95%, 2.576 for 99%)
- Margin of Error = Z-score × Standard Error
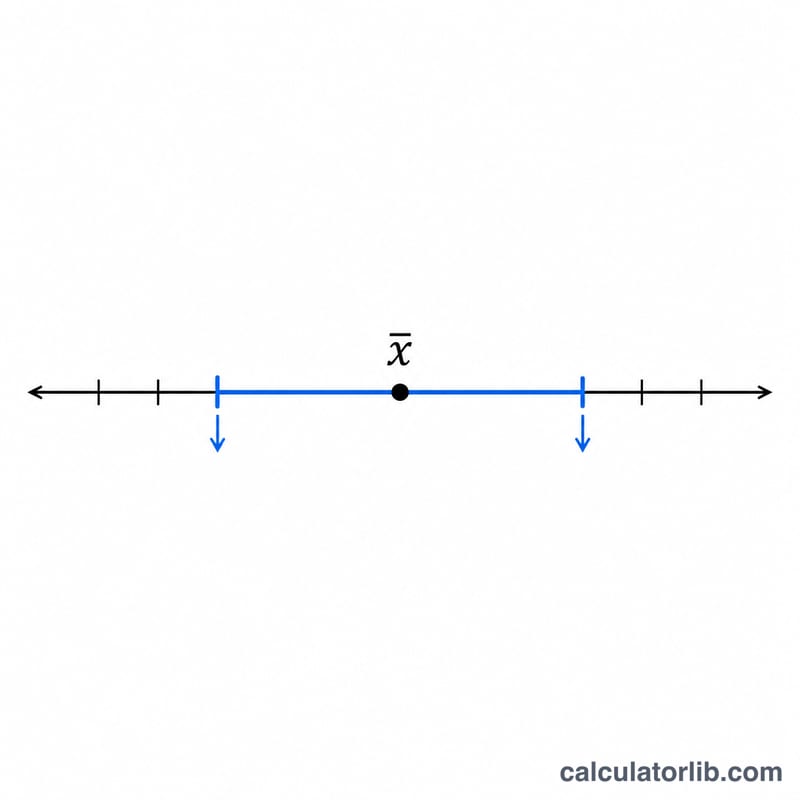
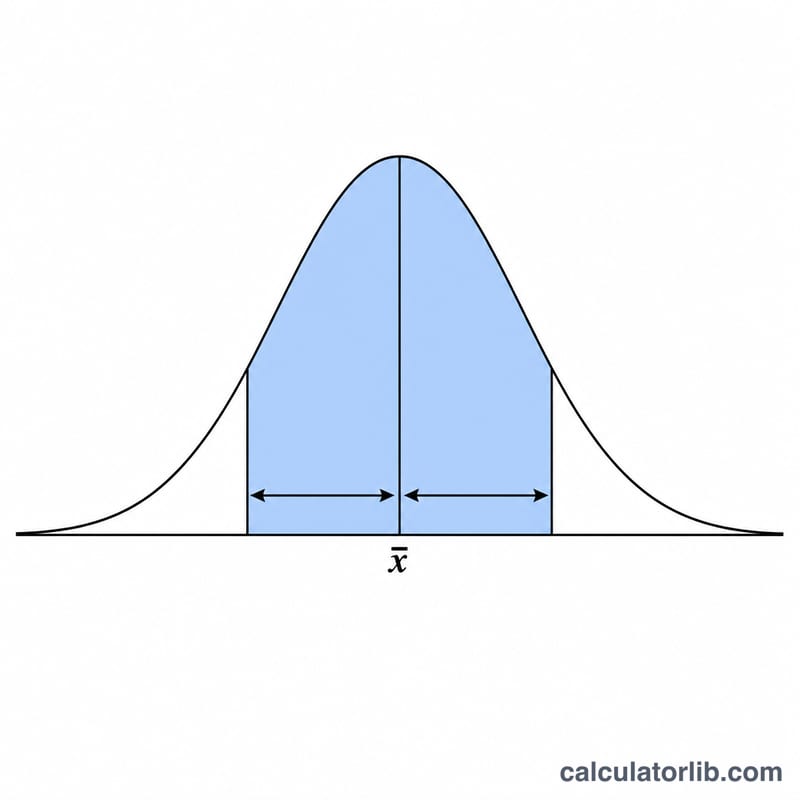
- Confidence Interval = Sample Mean ± Margin of Error
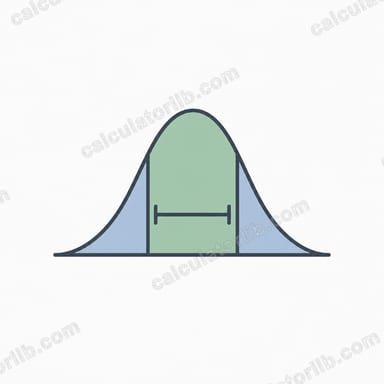
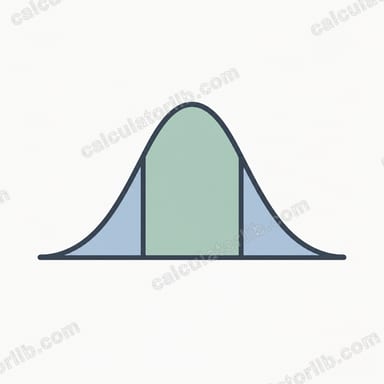
It finds the z-score by taking the inverse cumulative probability at alpha/2, where alpha = 1 − confidence level. This splits the uncertainty evenly between the two tails.
Worked Example
Suppose your sample mean is 100, standard deviation is 15, sample size is 36, and you choose a 95% confidence level.
- Standard Error = 15 ÷ √36 = 15 ÷ 6 = 2.5
- Z-score for 95% = 1.96
- Margin of Error = 1.96 × 2.5 = 4.9
- Lower bound = 100 − 4.9 = 95.1
- Upper bound = 100 + 4.9 = 104.9
You can be 95% confident the true population mean falls between 95.1 and 104.9.
Frequently Asked Questions
Does a wider interval mean a worse result? A wider interval reflects more uncertainty. Raising the confidence level (e.g. from 95% to 99%) or having a smaller sample widens the interval; a larger sample narrows it.
What does "95% confidence" actually mean? If you repeated the sampling many times and built an interval each time, about 95% of those intervals would contain the true population mean.
Should I use z or t? This tool uses the z (normal) distribution, which is appropriate for larger samples or when the population standard deviation is known. For very small samples with an unknown population standard deviation, a t-distribution is technically more precise.