
What This Calculator Does
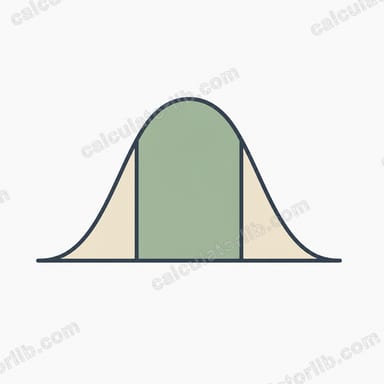
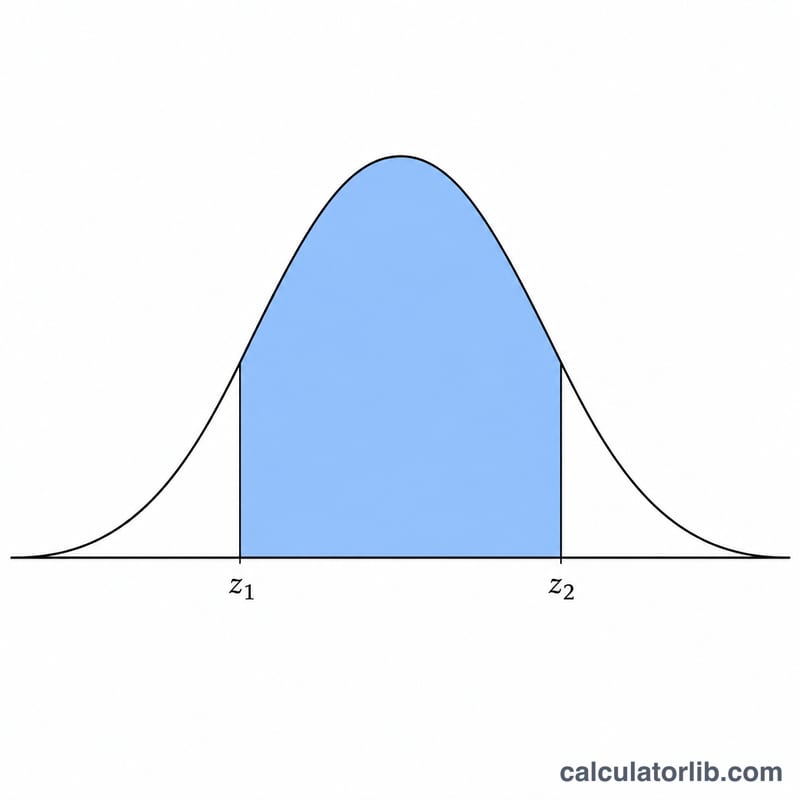
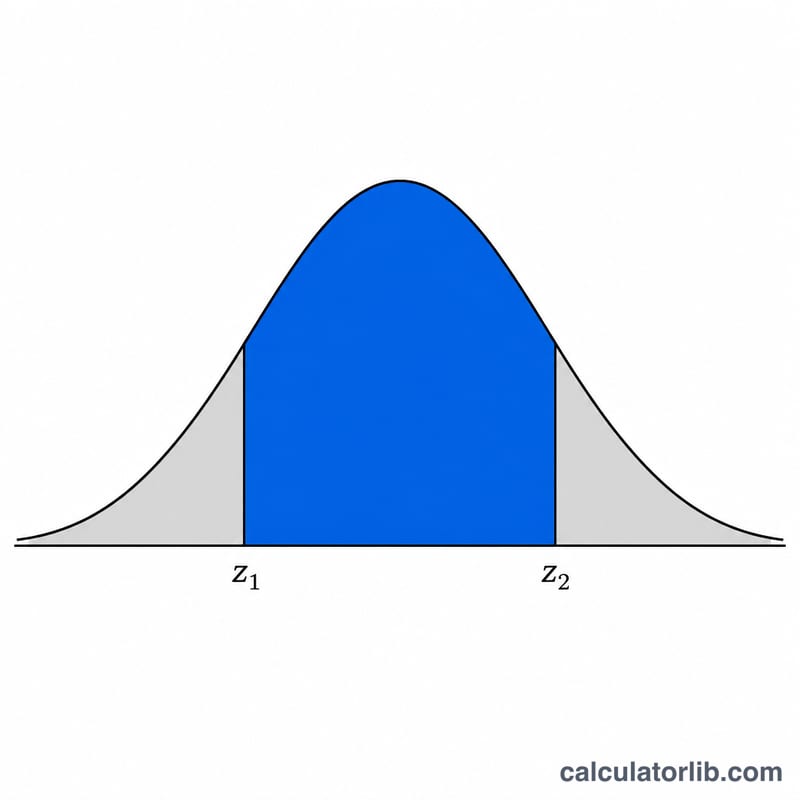
The Probability Between Two Z-Scores Calculator finds the area under the standard normal curve that lies between any two z-scores you choose. In statistics, the standard normal distribution has a mean of 0 and a standard deviation of 1. The total area under its bell-shaped curve equals 1 (or 100%), and the area between two points represents the probability that a standardized value falls in that range. This tool reports that central probability along with the two tail probabilities on either side.
The Inputs You Provide
- Lower Z-Score: the smaller of the two boundaries on the horizontal axis.
- Upper Z-Score: the larger boundary.
You do not have to worry about ordering — if you accidentally enter a larger value as the lower bound, the calculator automatically swaps them so the lower number is always treated as the left edge.
The Formula It Uses
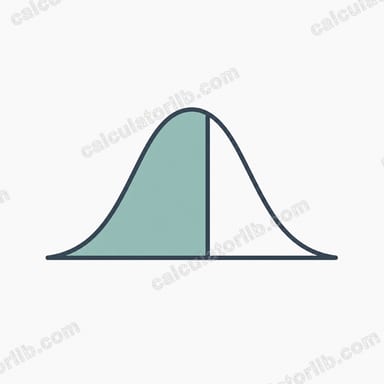
Let Φ(z) be the cumulative distribution function (CDF) of the standard normal distribution — the area to the left of a z-score. The calculator computes three results:
- Probability between: P(z₁ ≤ Z ≤ z₂) = Φ(z₂) − Φ(z₁)
- Left tail: P(Z < z₁) = Φ(z₁)
- Right tail: P(Z > z₂) = 1 − Φ(z₂)
Each value is shown as both a decimal probability and a percentage. The three areas always add up to 1 (100%).
Worked Example
Suppose you enter a lower z-score of −1 and an upper z-score of 1. The CDF values are Φ(1) ≈ 0.8413 and Φ(−1) ≈ 0.1587.
- Probability between: 0.8413 − 0.1587 = 0.6827, or about 68.27%
- Left tail (below −1): 0.1587, or 15.87%
- Right tail (above 1): 1 − 0.8413 = 0.1587, or 15.87%
This confirms the well-known "68% rule" — roughly 68% of normally distributed data lies within one standard deviation of the mean.
Frequently Asked Questions
Can I use negative z-scores? Yes. Z-scores can be negative (values below the mean) or positive (above it). Both inputs accept any real number.
What if both z-scores are the same? The area between two identical points is zero, so the probability between will be 0%, with the left and right tails accounting for the rest.
How do I get a z-score from raw data? Convert a raw value x using z = (x − mean) ÷ standard deviation, then enter the resulting z-scores here to find the probability between them.