
What this calculator does
This Standard Deviation Calculator takes a list of numbers you type in and instantly returns the sample standard deviation along with a full set of summary statistics: mean, median, variance, minimum, maximum, count, and sum. It's built for students, analysts, researchers, and anyone who needs to understand how spread out a set of values is without opening a spreadsheet.
How to use it
There is a single input field: Enter numbers (comma-separated). Type or paste your values separated by commas, semicolons, or spaces — the calculator is flexible about separators and trims blank entries automatically. For example, you can enter 4, 8, 15, 16, 23, 42 and submit.
- Mean – the average of all values
- Median – the middle value (50th percentile)
- Standard deviation – how much values typically deviate from the mean
- Variance – the square of the standard deviation
- Min, Max, Count, Sum – quick descriptive figures
The formula explained
The tool uses the sample standard deviation formula:
$$s = \sqrt{\frac{\sum_{i=1}^{n} (x_i - \bar{x})^2}{n - 1}}$$
Here \(x_i\) is each number, \(\bar{x}\) is the mean, and \(n\) is the count. Note the divisor is \(n - 1\), not \(n\) — this is Bessel's correction, which gives an unbiased estimate when your data is a sample drawn from a larger population. Variance is simply \(s^2\).
Worked example
Take the values 4, 8, 15, 16, 23, 42:
- Count = 6, Sum = 108
- Mean = 108 ÷ 6 = 18
- Squared deviations: (4−18)² + (8−18)² + (15−18)² + (16−18)² + (23−18)² + (42−18)² = 196 + 100 + 9 + 4 + 25 + 576 = 910
- Variance = 910 ÷ (6 − 1) = 182
- Standard deviation = √182 ≈ 13.49
The median for this set is the average of the two middle values (15 and 16) = 15.5.
Interpreting Your Result
The standard deviation (SD) tells you how far, on average, individual values fall from the mean of your dataset. It is reported in the same units as your data, which makes it directly interpretable.
- Larger SD — the values are more spread out and vary widely around the mean.
- Smaller SD — the values cluster tightly near the mean and are more consistent.
- SD of 0 — every value is identical (there is no variation at all), so the mean equals each value.
Because SD depends on the scale of the data, it is hard to compare spread between datasets measured in different units or with very different means. For that, use the coefficient of variation (CV), defined as the SD divided by the mean and usually expressed as a percentage:
$$\text{CV} = \frac{s}{\bar{x}} \times 100\%$$For example, a dataset with \(s = 6\) and \(\bar{x} = 40\) has a CV of 15%, meaning the spread is 15% of the mean — a relative measure you can compare against datasets on entirely different scales.
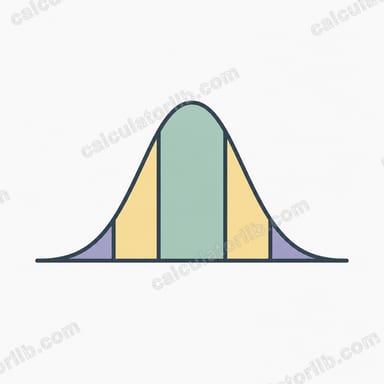
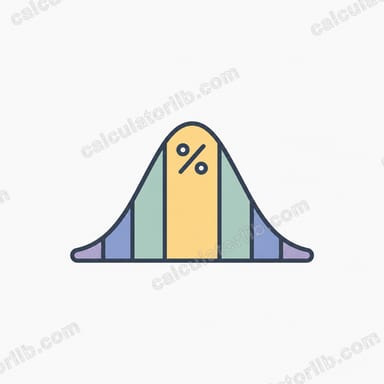
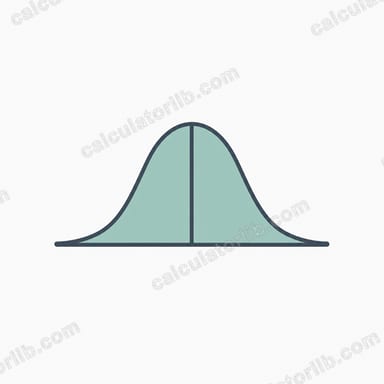
When your data is roughly bell-shaped (approximately normal), the empirical rule gives a quick sense of how SD relates to the distribution:
- About 68% of values fall within 1 SD of the mean (between \(\bar{x}-s\) and \(\bar{x}+s\)).
- About 95% fall within 2 SD of the mean.
- About 99.7% fall within 3 SD of the mean.
So for normal-looking data with \(\bar{x}=100\) and \(s=10\), roughly 95% of values would lie between 80 and 120. Values beyond 2–3 SD are uncommon and may warrant a look as potential outliers.
Definitions & Glossary
- Mean (\(\bar{x}\))
- The arithmetic average — the sum of all values divided by the count. It is the center point that deviations are measured from.
- Median
- The middle value when the data is sorted; with an even count it is the average of the two middle values. It is less affected by outliers than the mean.
- Standard deviation (s)
- The typical distance of values from the mean, in the original units — the square root of the variance.
- Variance (\(s^2\))
- The average of the squared deviations from the mean (using \(n-1\) for a sample). It is in squared units, which is why SD is usually preferred for interpretation.
- Sample vs population
- A sample is a subset drawn from a larger group and divides by \(n-1\); a population includes every member and divides by \(n\). This tool computes the sample SD.
- Bessel's correction (\(n-1\))
- Dividing by \(n-1\) instead of \(n\) when using a sample. It corrects the tendency of the sample variance to underestimate the true population variance.
- Deviation
- The difference between an individual value and the mean, \(x_i - \bar{x}\). Squaring these deviations is the core of the variance calculation.
- Count (n)
- The number of values entered — the size of your dataset.
- Sum
- The total of all values added together; dividing it by the count gives the mean.
- Min
- The smallest value in the dataset.
- Max
- The largest value in the dataset; max minus min gives the range.
FAQ
Does this use sample or population standard deviation? It calculates the sample standard deviation, dividing by \(n - 1\). If you need the population value (dividing by \(n\)), the difference is small for large datasets but more noticeable for small ones.
What separators can I use? Commas, semicolons, spaces, or line breaks all work, so you can paste a column from a spreadsheet directly.
Why is variance shown alongside standard deviation? Variance is the standard deviation squared. It's useful in statistical tests and ANOVA, while standard deviation is easier to interpret because it's in the same units as your data.