
What This Gross Salary Calculator Does
Most salary tools work forwards — you enter a gross figure and they tell you what lands in your pocket. This calculator works the other way around. You start with the take-home pay you actually want, and it tells you the gross salary you need to negotiate or quote to end up there after tax and deductions. That makes it useful for freelancers setting rates, employees negotiating offers, or anyone budgeting from a target net income. Because tax systems vary, the calculator uses a single flat tax rate you supply rather than country-specific brackets, so it works anywhere as long as you know your effective rate.
The Three Inputs
- Desired Net Salary — the amount you want to receive after tax and deductions are taken out.
- Tax Rate (%) — your effective tax rate applied to gross pay, entered as a percentage (e.g. 20 for 20%).
- Other Deductions — any fixed amounts removed from gross pay that are not percentage-based tax, such as pension contributions, insurance, or union fees.
The Formula
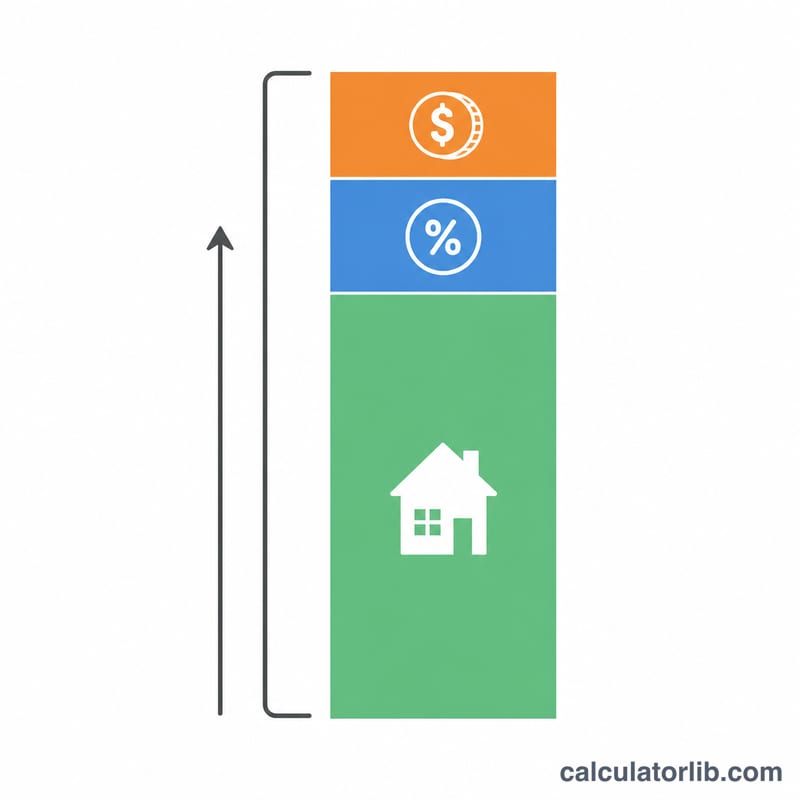
The calculator reverses the usual deduction process. Tax is treated as a percentage of gross, while other deductions are a fixed sum, so the gross needed is:
$$\text{Gross Salary} = \frac{\text{Net Salary} + \text{Deductions}}{1 - \dfrac{\text{Tax Rate (\%)}}{100}}$$
It then derives two extra figures: the tax amount = \(\text{Gross} \times \dfrac{\text{Tax Rate}}{100}\), and the take-home percentage = \(\dfrac{\text{Net Salary}}{\text{Gross}} \times 100\), showing what share of gross you actually keep.
Worked Example
Suppose you want a net salary of 40,000, your effective tax rate is 25%, and you have 2,000 in other deductions.
- $$\text{Gross} = \frac{40{,}000 + 2{,}000}{1 - 0.25} = \frac{42{,}000}{0.75} = \mathbf{56{,}000}$$
- $$\text{Tax amount} = 56{,}000 \times 0.25 = \mathbf{14{,}000}$$
- $$\text{Take-home percentage} = \frac{40{,}000}{56{,}000} \times 100 = \mathbf{71.4\%}$$
So you would need a gross salary of 56,000 to take home 40,000 after a 25% tax and 2,000 in deductions.
Interpreting Your Result
The gross figure this calculator returns is the pre-deduction salary, contract rate or invoice amount you need to be paid so that, after the tax rate and fixed deductions you entered, the net amount you asked for is what remains. It is not the total cost to an employer. In most countries employers also pay social-security, payroll or insurance contributions on top of gross pay, and those employer-side costs are outside this model entirely. If you are quoting a rate to a client or negotiating a package, the employer's or client's total outlay will be higher than the gross shown here.
The relationship the tool solves is:
$$\text{Gross} = \frac{ {\text{Net} + \text{Deductions}}}{1 - \dfrac{\text{Tax Rate}}{100}}$$Worked example. Suppose you want a net of 4,000 per period, you enter an effective tax rate of 25%, and you have 300 of fixed deductions (pension, insurance, union dues):
$$\text{Gross} = \frac{4000 + 300}{1 - \dfrac{25}{100}} = \frac{4300}{0.75} = 5733.33$$So the required gross is 5,733.33. Tax is 25% of that gross, or 1,433.33, and 1,433.33 + 300 + 4,000 = 5,733.33, which confirms the arithmetic.
Why the take-home percentage is lower than you expect
Take-home percentage is simply net ÷ gross × 100. In the example above that is 4,000 ÷ 5,733.33 = 69.8%, not the 75% you might read off "100% − 25% tax". Whenever other deductions are non-zero, the take-home percentage is always below (100 − tax rate), because the fixed deduction is money that leaves your gross without being tax. The larger the deduction relative to pay, the wider that gap. Only when deductions are zero do the two figures coincide.
If the result looks implausibly high
The single most common cause is entering a marginal tax rate — the rate applied to the next unit of income, often the headline top-bracket figure — instead of an effective (average) rate. Because progressive systems tax earlier slices of income at lower rates, the effective rate is usually well below the marginal rate, sometimes by 10 to 20 percentage points. Feeding a marginal rate into this formula inflates the required gross substantially. Divide your actual total tax by your actual total gross from a recent payslip or tax return to get the effective rate this tool expects.
What the model cannot do
The calculation is linear in gross: tax is a constant percentage of whatever gross is produced. That means it does not reproduce:
- progressive tax brackets, where the rate rises in steps as income grows;
- tapered or withdrawn personal allowances, which raise the effective rate over a specific income band;
- thresholds where a benefit, credit or subsidy phases out;
- contribution ceilings or floors, where a levy stops applying above or below a certain income;
- deductions that are themselves percentage-based (for example a pension contribution set at 5% of gross) — those interact with the gross being solved for, and entering them as a flat amount only approximates the answer.
Note also the behaviour at extreme rates. As the tax rate approaches 100%, the denominator \(1 - \tfrac{r}{100}\) approaches zero and the required gross diverges toward infinity: at 90% you need ten times the (net + deductions) figure, at 99% you need one hundred times it. A rate of exactly 100% or above has no finite solution, which is why very high entered rates produce extreme or undefined output. That is the mathematics behaving correctly, not an error.
Finally, the tool is currency-agnostic and not tied to any one country's tax code — it applies whatever single rate you supply. Treat the output as an estimate for planning, budgeting and comparing offers, not as a tax calculation, a withholding figure, or anything suitable for filing. This is general information only and not professional tax, financial or legal advice; for a binding figure, consult a qualified adviser or your national tax authority.
Key Terms Defined
- Gross salary
- Total pay before any tax, social contributions or other deductions are taken off — the headline number on a job offer or contract. It is the quantity this calculator solves for.
- Net pay (take-home pay)
- The amount that actually reaches your bank account after tax and all deductions. It is the target you enter into the calculator.
- Effective (average) tax rate
- Total tax paid divided by gross income, expressed as a percentage. If you paid 9,000 of tax on 40,000 of gross, your effective rate is 9,000 ÷ 40,000 = 22.5%. This is the rate this tool requires.
- Marginal tax rate
- The rate applied to the next unit of income you earn — the rate of the bracket you currently sit in. It is useful for deciding whether extra work or a raise is worthwhile, but it is the wrong input for this calculator: in a progressive system it exceeds the effective rate and will overstate the gross you need.
- Grossing up
- Working backwards from a desired net amount to the gross amount that produces it, rather than forwards from gross to net. Employers use it for tax-equalised relocation packages and net-guarantee contracts; freelancers use it to set a day rate. That backwards calculation is exactly what this tool performs.
- Other (fixed) deductions
- Flat amounts subtracted from gross that are not the tax itself — for example pension or retirement contributions, health or life insurance premiums, union fees, salary-sacrifice items or loan repayments. Enter them as a single total in the same currency and the same pay period as the net figure.
- Take-home percentage
- Net ÷ gross × 100 — the share of your headline salary you actually keep. It falls below (100 − tax rate) whenever fixed deductions are present, because those deductions reduce net without being counted as tax.
- Pre-tax vs. post-tax deduction
- A pre-tax deduction reduces the income on which tax is assessed, so it lowers your tax bill as well as your pay; a post-tax deduction comes out of money already taxed. Which category a given item falls into depends on your country's rules. This tool treats the "other deductions" figure as coming off gross alongside the tax, not as reducing taxable pay — so if your deduction is genuinely pre-tax under local law, the gross shown here will be slightly overstated.
These definitions are general and descriptive; the treatment of any specific deduction is set by the tax law of the country you are paid in, and this text is not tax advice.
Income and jobs: United States
Average income and unemployment in United States compared with the world, from the World Bank: a benchmark for the figures you enter above.
- GNI per capita 2025
- 88,810 USD
- GDP per capita, PPP 2025
- 90,027 intl. $
- World: 25,704
- Unemployment 2025
- 4.2%
- World: 4.8%
Latest change Up +7.1% 2025: 88,810 USD, against 82,910 USD in 2024. CalculatorLib computes this change from the two published figures.
In 2025, gross national income per person in United States was 88,810 US dollars a year, about 7,401 US dollars a month. World: 14,244 USD
| Year | GNI per capita (USD) | GDP per capita, PPP (intl. $) | Unemployment |
|---|---|---|---|
| 2025 | 88,810 | 90,027 | 4.2% |
| 2024 | 82,910 | 86,170 | 4.0% |
| 2023 | 79,950 | 82,587 | 3.6% |
| 2022 | 77,230 | 78,009 | 3.7% |
| 2021 | 71,510 | 71,441 | 5.3% |
| 2020 | 64,630 | 64,465 | 8.1% |
| 2019 | 65,840 | 65,228 | 3.7% |
| 2018 | 63,040 | 62,876 | 3.9% |
| 2017 | 58,860 | 60,048 | 4.4% |
| 2016 | 56,830 | 57,977 | 4.9% |
GNI per capita (Atlas method) is the average of all income in the economy, not a typical salary; PPP dollars adjust for local prices.
Income tax and social security: United States
- Top income tax rate 2025
- 43.65%
- from 8.7 × the average wage
- Employee social security 2025
- 7.65% · 1.45%
In 2025, the top statutory personal income tax rate in United States (central and local government combined) was 43.65%. It applies from 8.7 times the average wage of 73,520 USD, that is from about 642,101 USD a year.
Employee social security contribution rates for successive earnings bands, lowest band first; the band limits are not shown.
Top income tax rates in OECD countries
| Country | Top rate | Applies from (× average wage) | Year |
|---|---|---|---|
| Japan | 55.95% | 7.7 | 2025 |
| France | 55.37% | 12.9 | 2025 |
| South Korea | 49.5% | 19.0 | 2025 |
| Germany | 47.48% | 4.4 | 2025 |
| United Kingdom | 45% | 2.2 | 2025 |
| United States | 43.65% | 8.7 | 2025 |
| Türkiye | 40.76% | 5.6 | 2025 |
| Mexico | 35% | 20.6 | 2025 |
The top rate is the statutory rate on the highest earnings, not the rate most workers pay. OECD figures cover OECD member countries only.
United States and other countries
GNI per capita in current US dollars (Atlas method) — each country’s latest published year.
- United States 88,810 USD (2025)
- France 48,630 USD (2025)
- Japan 38,340 USD (2025)
- South Korea 37,880 USD (2025)
- Saudi Arabia 36,070 USD (2025)
- Türkiye 16,300 USD (2025)
- Russia 15,960 USD (2025)
- World 14,244 USD (2025)
- China 14,230 USD (2025)
- Mexico 13,730 USD (2025)
- Vietnam 4,970 USD (2025)
- India 2,760 USD (2025)
No published figure yet for Taiwan.
Years can differ between rows: each figure is shown with its own year. The same World Bank indicator for every country.
Latest figure: 2025 Data last updated 2026-10-18 · current
Source: The World Bank Group CC BY 4.0; OECD, Tax Database CC BY 4.0
Monthly figures are computed by CalculatorLib from these data. The top-rate threshold in national currency (multiple × average wage) is computed by CalculatorLib from these data.
Source details and methodology
- The World Bank Group — World Development Indicators (NY.GNP.PCAP.CD, NY.GDP.PCAP.PP.CD, SL.UEM.TOTL.ZS)
- OECD, Tax Database — Top statutory personal income tax rate; employee social security contribution rates
FAQ
Why is the deduction added to net before dividing? Because fixed deductions come out of gross pay, you must "gross up" both your target net and those deductions together, then account for the percentage tax.
What tax rate should I use? Use your effective (average) rate, not your top marginal bracket, since this is a flat-rate model rather than a progressive one.
Can I use this for any currency or country? Yes — it has no built-in country tax tables, so it works with any currency as long as you provide a realistic flat tax rate.