
What this calculator does
The A/B Test Significance Calculator tells you whether the difference between two conversion rates is likely real or just random noise. It runs a classic two-proportion z-test on the visitors and conversions of your control (Variant A) and your challenger (Variant B), returning a Z-score, a two-tailed p-value, the relative uplift, and a clear significant / not-significant verdict at your chosen confidence level.
How to use it
Enter the number of visitors and the number of conversions for each variant, then pick a confidence level (90%, 95%, or 99%). The most common choice is 95%, which corresponds to a critical Z of 1.96. If the absolute Z-score meets or exceeds the critical threshold, the result is flagged statistically significant.
The formula explained
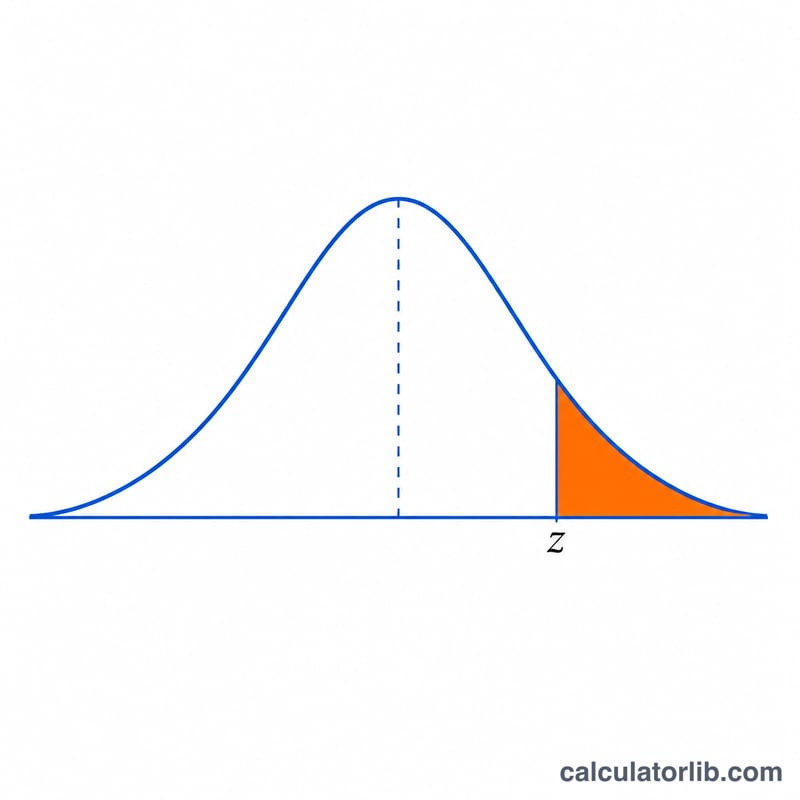
Each conversion rate is \(\hat{p} = \text{conversions} / \text{visitors}\). The test pools both samples into a single proportion $$\hat{p} = \frac{c_A + c_B}{n_A + n_B}$$ to estimate a common standard error. The Z-score is the observed difference in rates divided by that standard error: $$z = \frac{\hat{p}_B - \hat{p}_A}{\sqrt{\hat{p}(1-\hat{p})\left(\frac{1}{n_A}+\frac{1}{n_B}\right)}}$$ A larger absolute Z means the gap is less likely to be due to chance. The two-tailed p-value is twice the upper-tail area beyond the Z-score under the standard normal curve.
Worked example
Variant A: 1000 visitors, 100 conversions (10.0%). Variant B: 1000 visitors, 130 conversions (13.0%). The pooled rate is \(230/2000 = 0.115\), the standard error is $$\sqrt{0.115 \times 0.885 \times \left(\frac{1}{1000} + \frac{1}{1000}\right)} \approx 0.01427$$ so \(Z \approx 0.03 / 0.01427 \approx 2.10\). At 95% confidence (critical \(Z = 1.96\)) the result is statistically significant, with a two-tailed p-value of about 0.036.
Critical Z-Values by Confidence Level
For a two-tailed Z-test the observed Z-score is compared against a critical value that depends on the chosen confidence level. The confidence level equals \(1-\alpha\), where \(\alpha\) is the significance threshold (the maximum acceptable probability of a false positive). The result is declared significant when the absolute Z-score exceeds the critical value, equivalently when the p-value is below \(\alpha\).
| Confidence level | Significance level \(\alpha\) | p-value threshold | Two-tailed critical Z |
|---|---|---|---|
| 90% | 0.10 | < 0.10 | 1.645 |
| 95% | 0.05 | < 0.05 | 1.960 |
| 99% | 0.01 | < 0.01 | 2.576 |
These critical values come from the standard normal distribution: each leaves \(\alpha/2\) of the probability in each tail. The 95% level (critical Z = 1.96) is the most common default in conversion-rate testing.
Key Terms Defined
- Conversion rate
- The proportion of visitors who completed the goal action, \(p = \text{conversions} / \text{visitors}\), for a given variant.
- Null hypothesis
- The default assumption that the two variants have the same true conversion rate, i.e. \(p_A = p_B\) and any observed difference is due to random chance.
- Pooled proportion
- The combined conversion rate of both variants, \(\bar{p} = (\text{conv}_A + \text{conv}_B)/(n_A + n_B)\), used to estimate variance under the null hypothesis.
- Standard error
- The estimated standard deviation of the difference in conversion rates, \(\sqrt{\bar{p}(1-\bar{p})(1/n_A + 1/n_B)}\); it shrinks as sample size grows.
- Z-score
- The observed difference in conversion rates expressed in standard-error units; larger magnitude means the difference is less likely under the null hypothesis.
- p-value
- The probability of observing a difference at least as extreme as the one measured, assuming the null hypothesis is true. Smaller p-values give stronger evidence against the null.
- Two-tailed test
- A test that detects a difference in either direction (B better or worse than A), splitting \(\alpha\) across both tails of the distribution.
- Confidence level
- \(1-\alpha\), the threshold (e.g. 95%) at which the result is judged significant; it sets how rarely a true null is wrongly rejected.
- Statistical significance
- The conclusion that the observed difference is unlikely to be due to chance alone, reached when the p-value falls below \(\alpha\).
- Relative uplift
- The percentage change of variant B over variant A, \((p_B - p_A)/p_A \times 100\%\), describing the size of the effect.
Interpreting Your Result
A significant result means the p-value is below your chosen \(\alpha\) (for example below 0.05 at 95% confidence), so the observed difference between variants is unlikely to have arisen by chance under the null hypothesis. A not significant result means the data are consistent with no real difference — it does not prove the variants are equal, only that you lack sufficient evidence to distinguish them.
Worked example: with 5,000 visitors and 250 conversions in A (\(p_A = 0.05\)) and 5,000 visitors and 300 conversions in B (\(p_B = 0.06\)), the pooled proportion is \(\bar p = 550/10000 = 0.055\). The standard error is \(\sqrt{0.055\times0.945\times(1/5000+1/5000)} \approx 0.004558\), giving \(Z = (0.06-0.05)/0.004558 \approx\) 2.19. Since 2.19 > 1.96, the result is significant at 95% confidence, with a relative uplift of 20%.
Several cautions follow directly from how these statistics are defined:
- The p-value is not the probability that B is better than A. It is the probability of the observed (or more extreme) data assuming the null is true — a statement about the data given a hypothesis, not about a hypothesis given the data.
- Significance is not the same as importance. With very large samples a tiny, commercially irrelevant uplift can be statistically significant. Always read the relative uplift and its practical value, not just the verdict.
- Sample size drives sensitivity. Small samples produce large standard errors, so a genuine effect can look non-significant; large samples detect smaller effects. Plan a target sample size before the test rather than stopping at the first significant reading.
- Avoid peeking and multiple testing. Repeatedly checking results and stopping as soon as p < 0.05 inflates the false-positive rate well above the nominal \(\alpha\). The fixed-horizon Z-test assumes you evaluate once at a predetermined sample size; testing many variants or metrics similarly multiplies the chance of a spurious "win" and warrants a stricter threshold.
This tool reports a frequentist two-tailed Z-test for proportions; it is general statistical information and not a substitute for a tailored experimental design when stakes are high.
FAQ
How many visitors do I need? There is no fixed number — small differences need large samples. If your result is borderline, collect more data before deciding.
What does the p-value mean? It is the probability of seeing a difference this large (or larger) if the two variants were actually identical. Smaller is stronger evidence of a real difference.
Should I stop the test as soon as it is significant? No. Repeatedly checking ("peeking") inflates false positives. Decide a sample size or duration in advance and evaluate then.


