What this calculator does
The one-sample z-test checks whether the mean of a sample differs significantly from a known or hypothesized population mean. It is the right test when the population standard deviation (sigma) is known. The tool reports the test statistic z, the standard error, the critical z value at your chosen significance level, the p-value, and a clear verdict on whether the difference is statistically significant.
How to use it
Enter the significance level alpha as a percent (5 means 0.05). Choose a two-sided test (the sample mean could be higher or lower) or a one-sided test (you only care about one direction). Then enter the hypothesized population mean (mu0), the known population standard deviation (sigma), your observed sample mean (x-bar), and the sample size (n). Click calculate to get the full result.
The formula explained
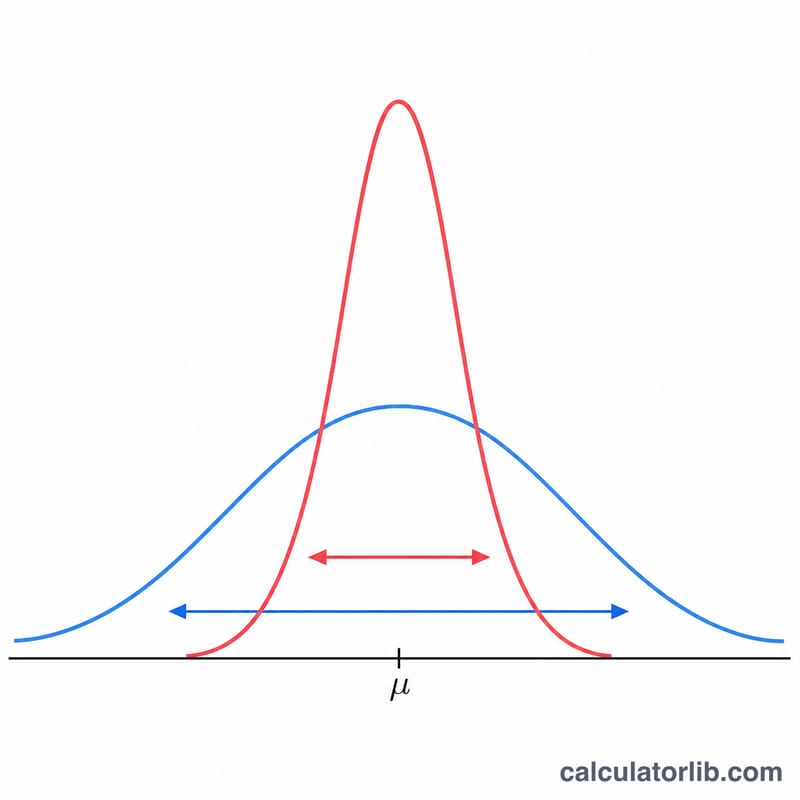
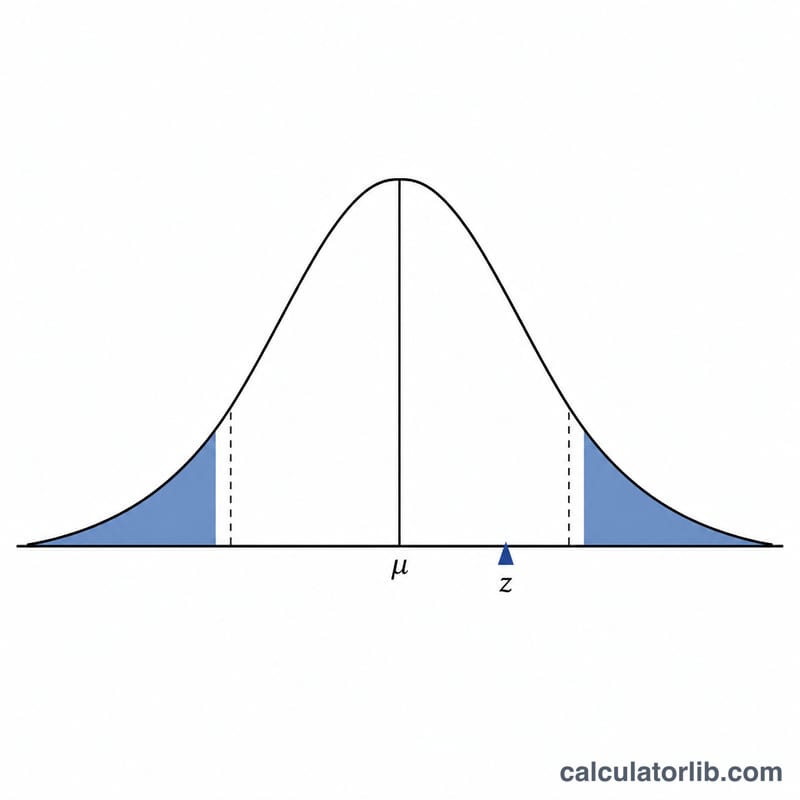
The standard error is \(\text{SE} = \sigma / \sqrt{n}\). The test statistic is $$z = \frac{\bar{x} - \mu_0}{\text{SE}}$$ The critical value comes from the inverse standard normal CDF: for a two-sided test \(z_{\text{crit}} = \Phi^{-1}(1 - \alpha/2)\); for a one-sided test \(z_{\text{crit}} = \Phi^{-1}(1 - \alpha)\). The p-value is \(2\left(1 - \Phi(|z|)\right)\) two-sided or \(1 - \Phi(|z|)\) one-sided, where \(\Phi\) is the standard normal cumulative distribution. The result is significant (reject the null hypothesis \(H_0: \bar{x} = \mu_0\)) when \(|z|\) exceeds \(z_{\text{crit}}\), equivalently when \(p\) is below \(\alpha\).
Worked example
With \(\mu_0 = 58\), \(\sigma = 4.5\), \(\bar{x} = 60\), \(n = 25\) and a two-sided test at \(\alpha = 5\%\): $$\text{SE} = \frac{4.5}{\sqrt{25}} = 0.9$$ $$z = \frac{60 - 58}{0.9} = 2.2222$$ The two-sided critical value \(\Phi^{-1}(0.975) = 1.95996\). Since \(2.2222 > 1.95996\) the difference is significant. The p-value is \(2\left(1 - \Phi(2.2222)\right) = 0.0263\), which is below \(0.05\), confirming the result.
FAQ
When should I use a t-test instead? Use a t-test when only the sample standard deviation is known (population sigma unknown), especially for small samples; it uses Student's t with \(n-1\) degrees of freedom.
What does the p-value mean? It is the probability of observing a deviation at least as extreme as yours if H0 were true. A small p-value (below alpha) suggests the difference is unlikely to be due to chance.
Two-sided or one-sided? Use two-sided unless you have a strong a-priori reason to test only one direction; one-sided tests have more power but only detect deviations in the chosen direction.


