What Is a One-Proportion Z-Test?
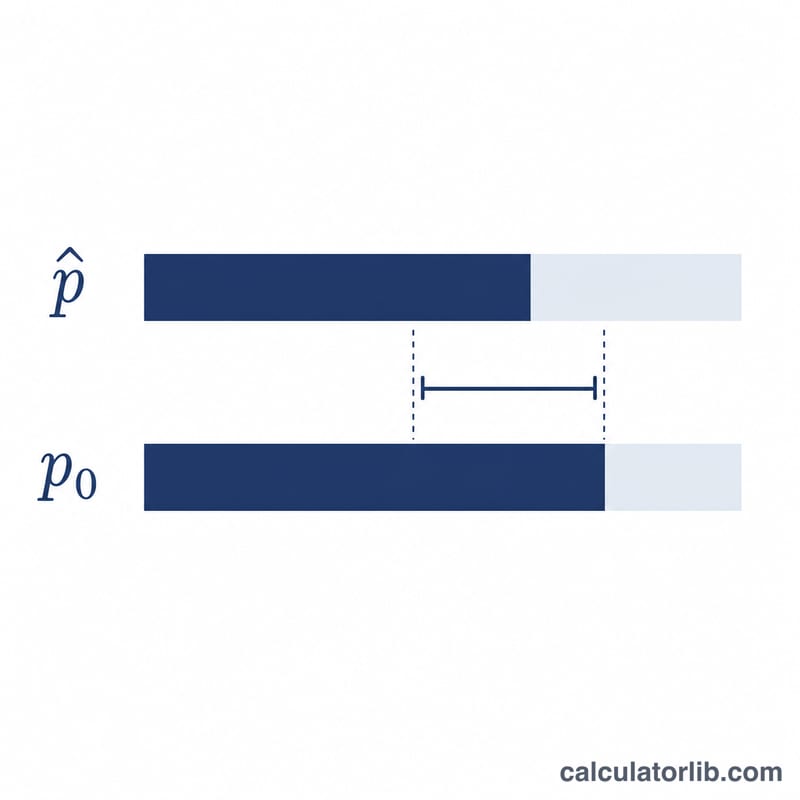
A one-proportion z-test checks whether a sample proportion (\(\hat{p}\)) differs significantly from a known or hypothesized population proportion (\(p_0\)). It is widely used in surveys, quality control, A/B testing, and medical studies whenever you measure a yes/no outcome and want to know if your observed rate is consistent with a claimed rate.
How to Use This Calculator
Enter the number of successes (\(x\)), the total sample size (\(n\)), and the hypothesized proportion (\(p_0\)) between 0 and 1. Choose your alternative hypothesis — two-tailed, left-tailed, or right-tailed. The calculator returns the sample proportion, the standard error, the z test statistic, and the corresponding p-value. Compare the p-value to your chosen significance level (commonly 0.05): if it is smaller, you reject the null hypothesis.
The Formula Explained
The standard error is computed under the null hypothesis as \(\sqrt{\dfrac{p_0(1-p_0)}{n}}\). The z statistic is the distance between the sample proportion and \(p_0\) measured in standard errors:
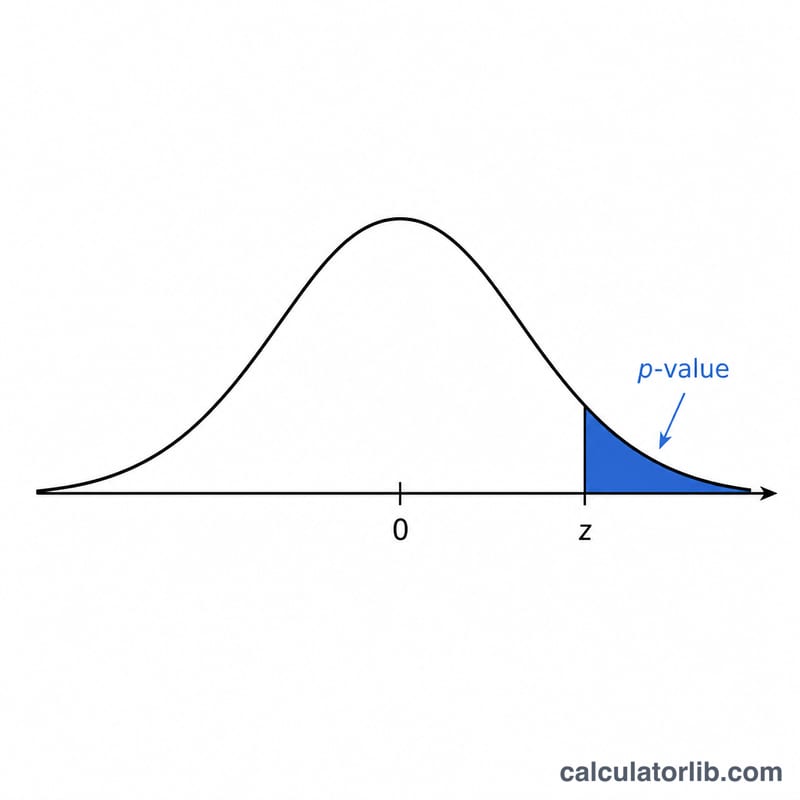
$$z = \frac{\hat{p} - p_0}{\sqrt{\dfrac{p_0(1-p_0)}{n}}}$$The p-value comes from the standard normal distribution. This test assumes the sampling distribution is approximately normal, which holds when \(n \cdot p_0 \geq 10\) and \(n \cdot (1-p_0) \geq 10\).
Worked Example
Suppose 45 of 100 people prefer a new product, and you want to test against \(p_0 = 0.5\). Then \(\hat{p} = 0.45\), \(\text{SE} = \sqrt{0.5 \cdot 0.5 / 100} = 0.05\), and
$$z = \frac{0.45 - 0.5}{0.05} = -1.0$$A two-tailed p-value is about 0.317, so there is no significant difference from 50%.
FAQ
When should I use a z-test instead of a t-test? For proportions with a large enough sample, the z-test is standard; the t-test is for means with unknown variance.
What sample size is large enough? A common rule is at least 10 expected successes and 10 expected failures (\(n \cdot p_0 \geq 10\) and \(n \cdot (1-p_0) \geq 10\)).
What does a small p-value mean? It indicates the observed proportion would be unlikely if the true proportion equaled \(p_0\), providing evidence to reject the null hypothesis.


