What is a one-sample t-test?
A one-sample t-test checks whether the mean of a single sample differs significantly from a known or hypothesized population mean (\(\mu_0\)). It is used when the population standard deviation is unknown and is estimated from the sample. This calculator returns the t-statistic, the standard error, and the degrees of freedom so you can complete the test.
How to use this calculator
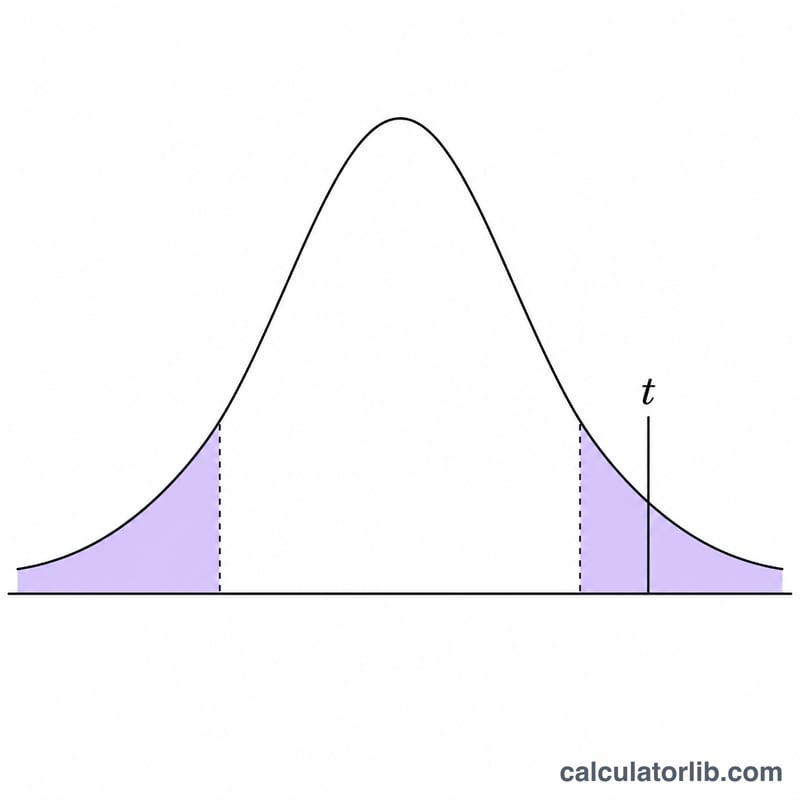
Enter four values: the sample mean (\(\bar{x}\)), the hypothesized population mean (\(\mu_0\)) you are testing against, the sample standard deviation (\(s\)), and the sample size (\(n\)). The calculator instantly returns the t-statistic. Compare its absolute value against a critical t-value (from a t-table at your chosen significance level and degrees of freedom), or convert it to a p-value, to decide whether to reject the null hypothesis.
The formula explained
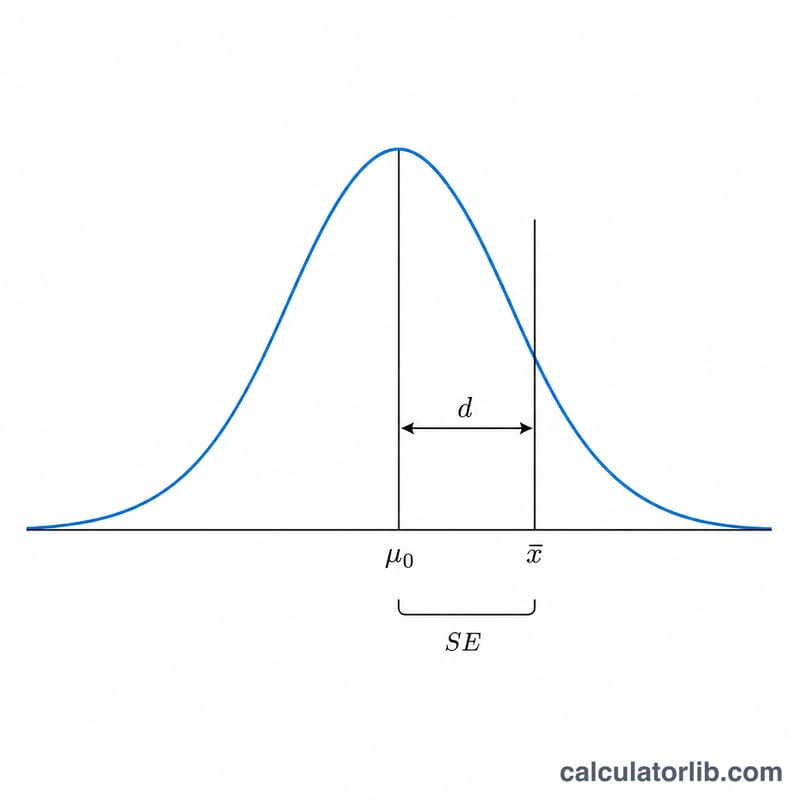
The statistic is $$t = \frac{\bar{x} - \mu_0}{s/\sqrt{n}}$$ The numerator (\(\bar{x} - \mu_0\)) is the observed difference between your sample mean and the hypothesized value. The denominator \(s/\sqrt{n}\) is the standard error of the mean — how much sample means typically vary. Dividing the difference by the standard error expresses it in standard-error units. Degrees of freedom are \(df = n - 1\).
Worked example
Suppose \(\bar{x} = 52\), \(\mu_0 = 50\), \(s = 4\), and \(n = 25\). The standard error is $$\frac{4}{\sqrt{25}} = \frac{4}{5} = 0.8$$ Then $$t = \frac{52 - 50}{0.8} = \frac{2}{0.8} = 2.5$$ with \(df = 24\). At a two-tailed \(\alpha = 0.05\) the critical value is about 2.064, so 2.5 exceeds it and the result is statistically significant.
FAQ
When should I use a t-test instead of a z-test? Use a t-test when the population standard deviation is unknown (estimated from the sample), especially with small samples.
What does a negative t mean? It simply means the sample mean is below \(\mu_0\). The sign indicates direction; the magnitude indicates strength.
How do I get a p-value? Use the t-statistic and df with a t-distribution table or software to find the area in the tail(s).


