What Is the One-Proportion Z-Test?
The one-proportion z-test (also called a one-sample proportion test) checks whether a population proportion differs from a known or hypothesized value. It is widely used for yes/no, pass/fail, or success/failure data — for example, testing whether a coin is fair, whether a conversion rate beats a benchmark, or whether a defect rate meets a target.
How to Use This Calculator
Enter the number of successes (x), the total sample size (n), and the hypothesized proportion (p₀, a value between 0 and 1). Choose your alternative hypothesis: two-tailed (the true proportion is simply different from p₀), left-tailed (less than p₀), or right-tailed (greater than p₀). The calculator returns the sample proportion, the standard error, the z statistic, and the corresponding p-value.
The Formula Explained
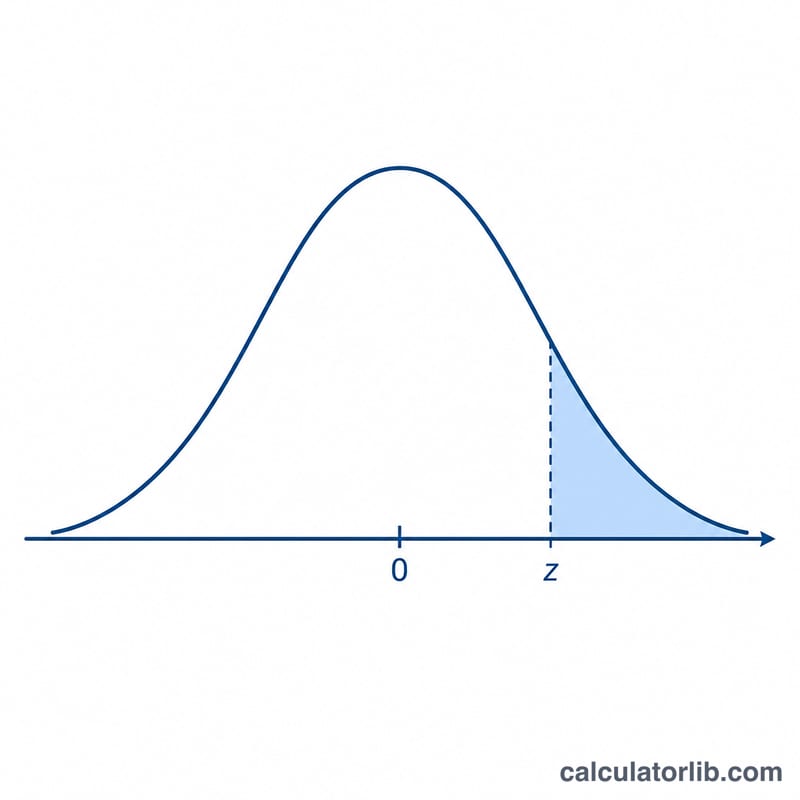
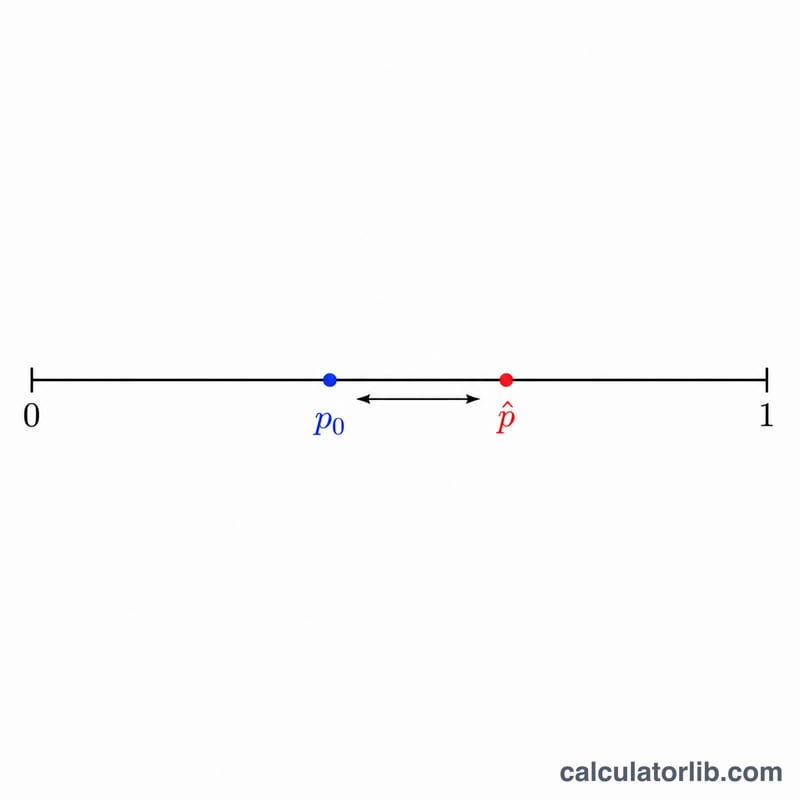
The test statistic is $$z = \dfrac{\hat{p} - \text{p}_0}{\sqrt{\dfrac{\text{p}_0\left(1 - \text{p}_0\right)}{\text{n}}}} \qquad \hat{p} = \dfrac{\text{x}}{\text{n}}$$ is the sample proportion. The denominator is the standard error of the proportion computed under the null hypothesis, which is why it uses p₀ rather than p̂. The resulting z is compared to the standard normal distribution to obtain a p-value. The normal approximation is reliable when both \(\text{n}\cdot\text{p}_0\) and \(\text{n}\cdot(1 - \text{p}_0)\) are at least about 5–10.
Worked Example
Suppose 55 of 100 voters favor a measure and you test p₀ = 0.5 with a two-tailed alternative. Then \(\hat{p} = 0.55\), the standard error $$= \sqrt{\dfrac{0.5\cdot 0.5}{100}} = 0.05$$ and $$z = \dfrac{0.55 - 0.5}{0.05} = 1.0$$ The two-tailed p-value \(\approx 0.317\), so at \(\alpha = 0.05\) you would not reject the null hypothesis.
FAQ
What is a good sample size? Ensure \(\text{n}\cdot\text{p}_0 \geq 5\) and \(\text{n}\cdot(1 - \text{p}_0) \geq 5\) so the normal approximation holds; otherwise use an exact binomial test.
One-tailed or two-tailed? Use two-tailed unless you have a directional hypothesis decided before collecting data.
How do I interpret the p-value? If the p-value is below your significance level (commonly 0.05), reject the null hypothesis that the true proportion equals p₀.


