What is a One-Sample t-Test?
A one-sample t-test checks whether the mean of a single sample differs significantly from a known or hypothesized population mean (\(\mu_0\)). It is used when the population standard deviation is unknown and is estimated from the sample. This calculator returns the t-statistic, the degrees of freedom, and the standard error so you can look up or compute a p-value.
How to Use It
Enter four values: the sample mean (\(\bar{x}\)), the hypothesized population mean (\(\mu_0\)), the sample standard deviation (\(s\)), and the sample size (\(n\)). Click calculate to obtain the test statistic. Compare the resulting t-value against a critical value from a t-distribution table at your chosen significance level and degrees of freedom, or convert it to a p-value.
The Formula Explained
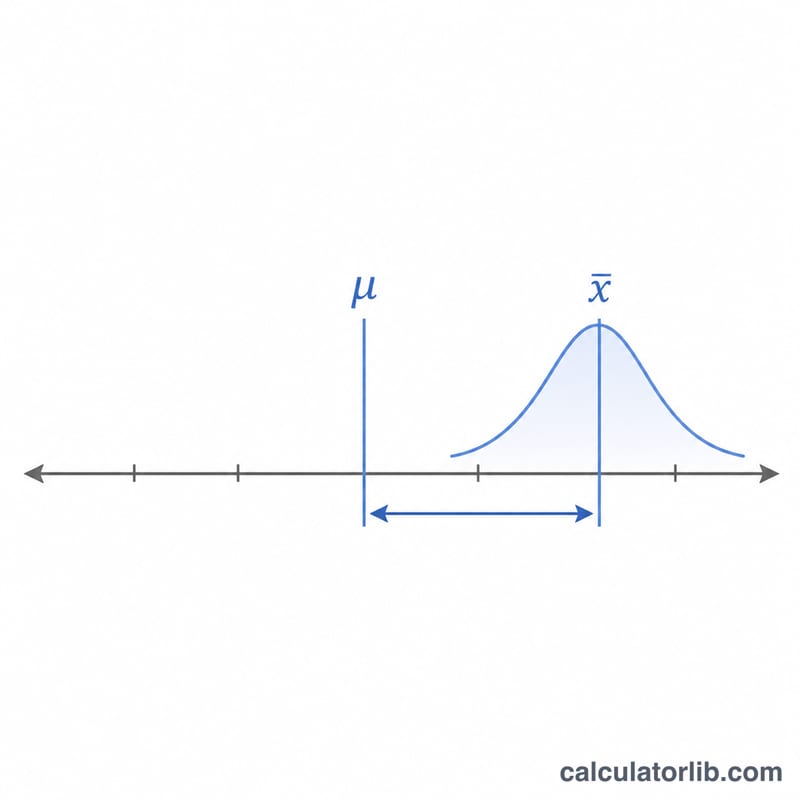
The statistic is $$t = \dfrac{\bar{x} - \mu_0}{s \big/ \sqrt{n}}$$ The numerator is how far the observed mean sits from the hypothesized value. The denominator, \(s / \sqrt{n}\), is the standard error of the mean — the typical sampling variability you would expect for a sample of that size. Dividing one by the other expresses the difference in standard-error units. Degrees of freedom equal \(n - 1\).
Worked Example
Suppose \(\bar{x} = 5.2\), \(\mu_0 = 5.0\), \(s = 1.0\), \(n = 25\). The standard error is $$1.0 / \sqrt{25} = 1.0 / 5 = 0.2$$ Then $$t = \frac{5.2 - 5.0}{0.2} = \frac{0.2}{0.2} = 1.0$$ with \(df = 24\). A t of 1.0 with 24 df is well below the two-tailed 5% critical value (\(\approx 2.064\)), so you would not reject the null hypothesis.
FAQ
When should I use a one-sample test instead of two-sample? Use one-sample when comparing a single group's mean against a fixed reference value; use two-sample when comparing the means of two independent groups.
What sample size do I need? The test technically works for \(n \geq 2\), but it assumes the data are roughly normal; small samples are more sensitive to that assumption.
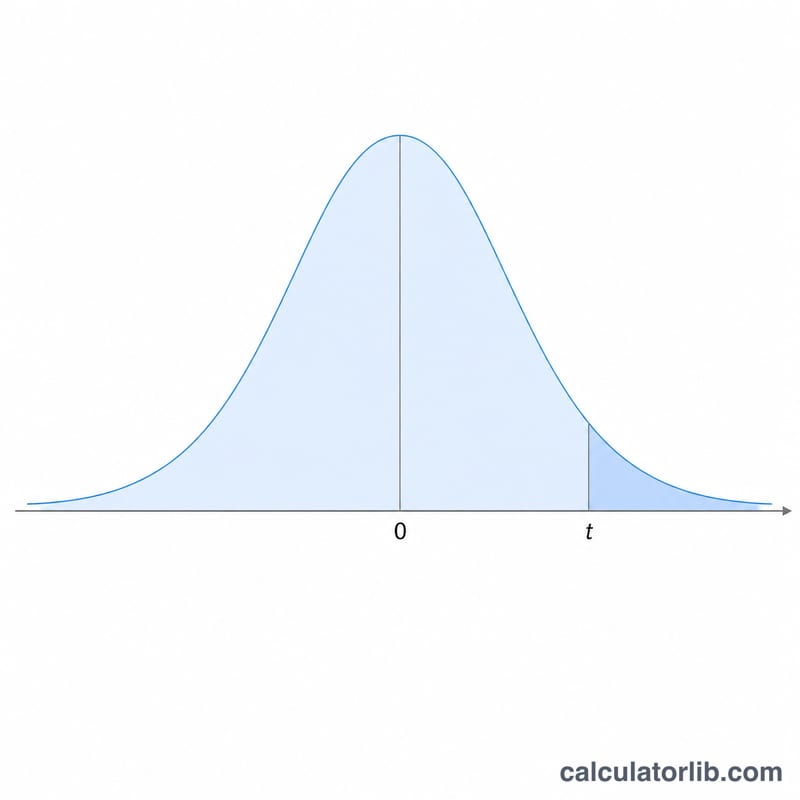
How do I get a p-value? Take the absolute t-value and df and use a t-distribution table or statistical software; for a two-tailed test, double the upper-tail probability.


