
What Is R-Squared?
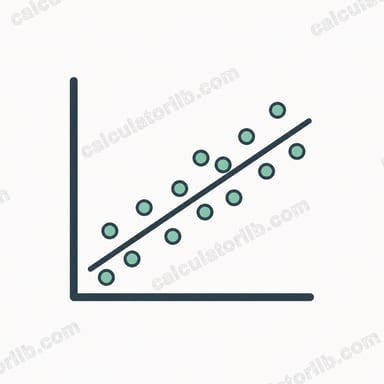
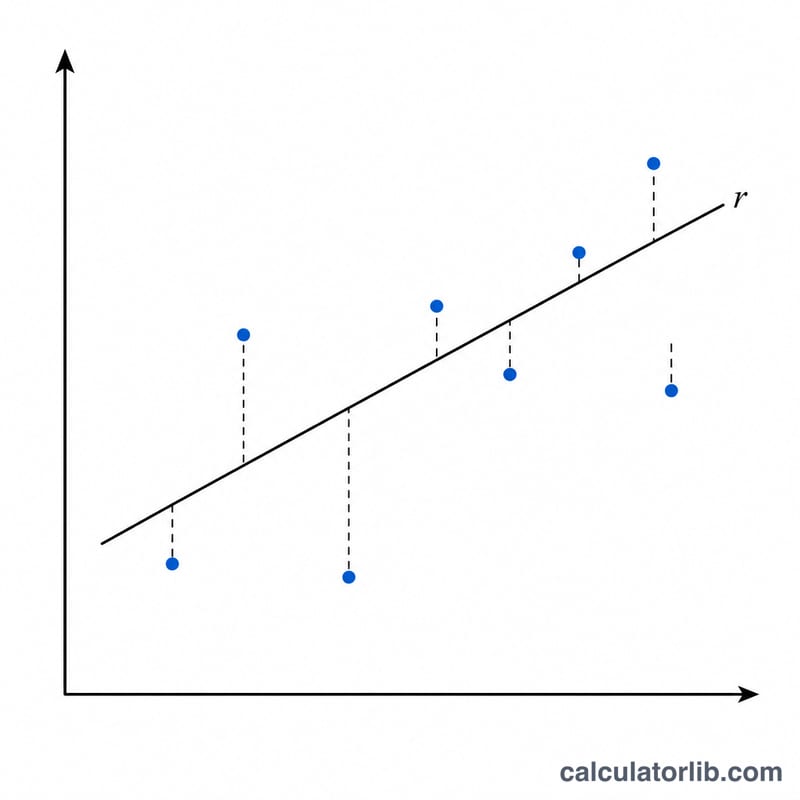
R-squared (R²), also called the coefficient of determination, measures how well a model's predictions match the observed data. It expresses the proportion of the variance in the dependent variable that is explained by the model. R² ranges from 0 to 1 for a sensible model: a value of 1 means the predictions perfectly fit the data, while 0 means the model explains none of the variability and is no better than predicting the mean. Negative values can occur when a model fits worse than a horizontal line at the mean.
How to Use This Calculator
Enter your observed values (the actual Y data) and your predicted values (the model's outputs Ŷ) as comma-separated lists. The two lists should be in the same order and the same length. Click calculate to get R² along with the residual sum of squares (\(SS_{res}\)), the total sum of squares (\(SS_{tot}\)), and the number of data points used.
The Formula Explained
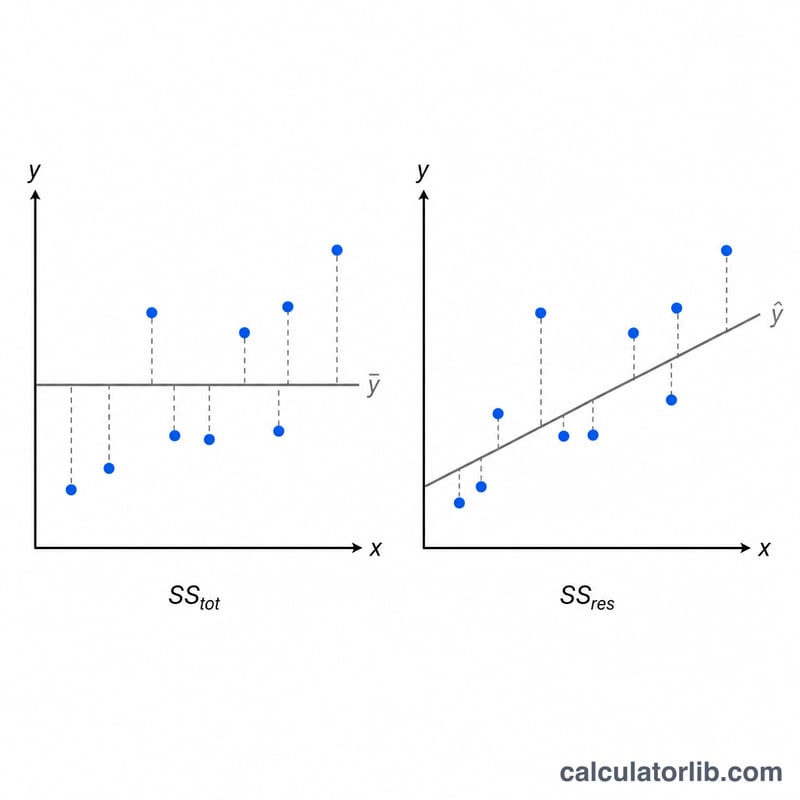
The calculator first computes the mean of the observed values. The total sum of squares is the sum of squared differences between each observation and that mean: $$SS_{tot} = \sum (y_i - \bar{y})^2.$$ The residual sum of squares is the sum of squared differences between observed and predicted values: $$SS_{res} = \sum (y_i - \hat{y}_i)^2.$$ R² is then $$R^2 = 1 - \frac{SS_{res}}{SS_{tot}}.$$ When residuals are small relative to total variation, \(SS_{res}/SS_{tot}\) is near zero and R² approaches 1.
Worked Example
Suppose the observed values are 3, −0.5, 2, 7 and the predicted values are 2.5, 0.0, 2, 8. The mean of the observed values is $$\frac{3 - 0.5 + 2 + 7}{4} = 2.875.$$ $$SS_{res} = 0.5^2 + (-0.5)^2 + 0^2 + (-1)^2 = 0.25 + 0.25 + 0 + 1 = 1.5.$$ $$SS_{tot} = (0.125)^2 + (-3.375)^2 + (-0.875)^2 + (4.125)^2 \approx 0.015625 + 11.390625 + 0.765625 + 17.015625 = 29.1875.$$ $$R^2 = 1 - \frac{1.5}{29.1875} \approx 0.9486.$$
FAQ
Can R² be negative? Yes. When the model fits worse than simply predicting the mean of the data, \(SS_{res}\) exceeds \(SS_{tot}\) and R² becomes negative.
Does a high R² mean a good model? Not always. A high R² indicates a close fit to this data but can result from overfitting. Always validate with out-of-sample data.
What's the difference between R² and adjusted R²? Adjusted R² penalizes adding predictors that don't improve the model, which is useful for multiple regression. This calculator reports the unadjusted R².