
What is the correlation coefficient?
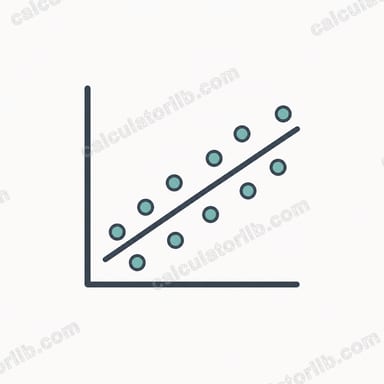
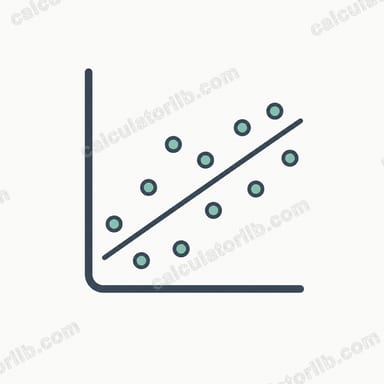
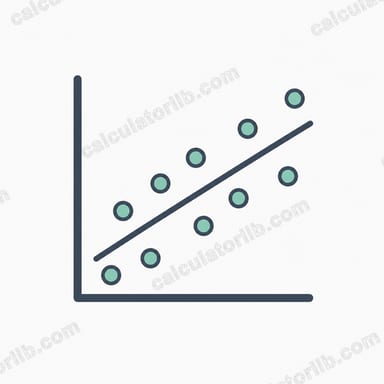
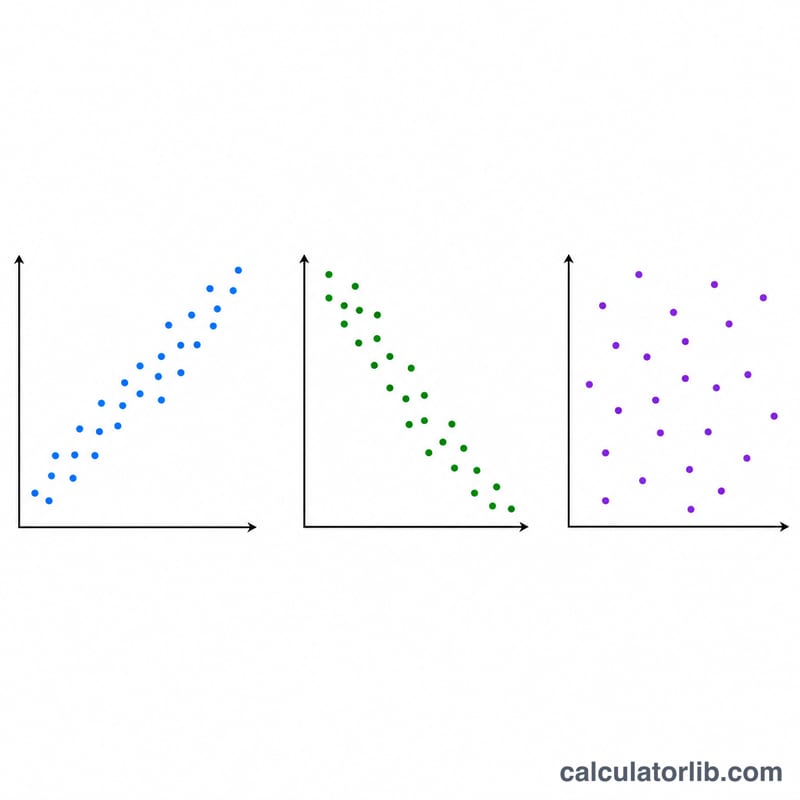
The Pearson correlation coefficient, written as r, measures how strongly two variables move together in a straight line. It always falls between −1 and +1. A value near +1 means a strong positive linear relationship (as X rises, Y rises), a value near −1 means a strong negative relationship, and a value near 0 means little or no linear relationship.
How to use this calculator
Enter your X values and your matching Y values, each list separated by commas or spaces. The two lists should have the same number of entries; if they differ, only the first matching pairs are used. The calculator returns r, the coefficient of determination r², the covariance, the means of each set, and the slope and intercept of the best-fit regression line.
The formula explained
For each pair we compute the deviation of x from its mean \((x - \bar{x})\) and of y from its mean \((y - \bar{y})\). The numerator sums the products of these deviations; the denominator is the square root of the product of the summed squared deviations. Dividing standardizes the result into the −1 to +1 range, so the magnitude is independent of the units of measurement.
$$r = \frac{\sum (x_i - \bar{x})(y_i - \bar{y})}{\sqrt{\sum (x_i - \bar{x})^2 \; \sum (y_i - \bar{y})^2}}$$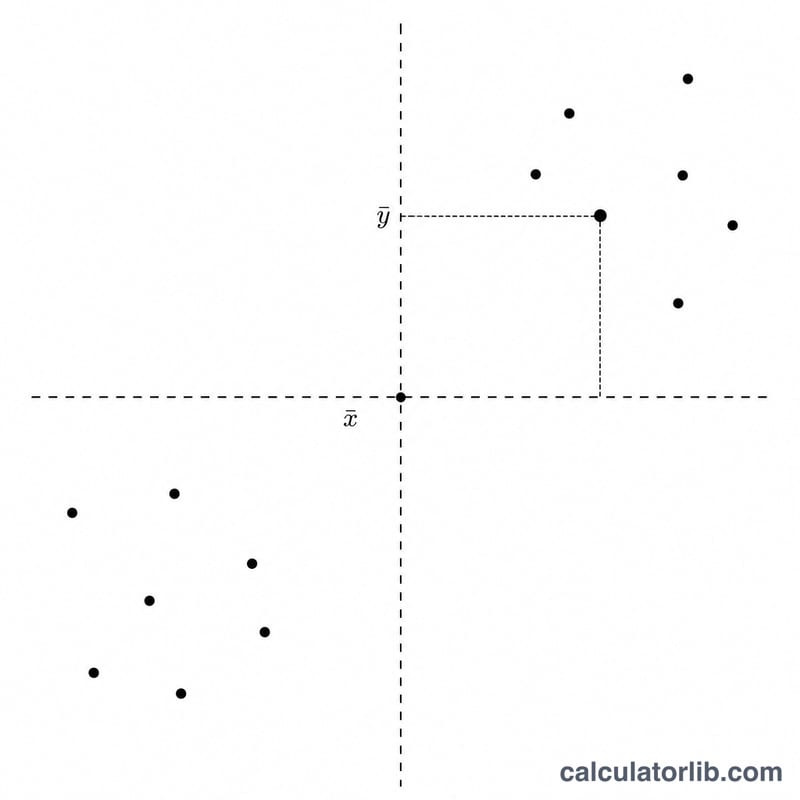
Worked example
Take X = 1, 2, 3, 4, 5 and Y = 2, 4, 5, 4, 5. The means are \(\bar{x} = 3\) and \(\bar{y} = 4\). The deviation products sum to 6, \(\sum (x - \bar{x})^2 = 10\) and \(\sum (y - \bar{y})^2 = 6\). So
$$r = \frac{6}{\sqrt{10 \times 6}} = \frac{6}{\sqrt{60}} \approx 0.7746$$giving \(r^2 \approx 0.6\). This indicates a fairly strong positive linear relationship.
FAQ
Does correlation imply causation? No. A high r only shows the variables move together; it does not prove one causes the other.
What is a "strong" correlation? As a rough guide, \(|r|\) above 0.7 is strong, 0.3–0.7 is moderate, and below 0.3 is weak — but context matters.
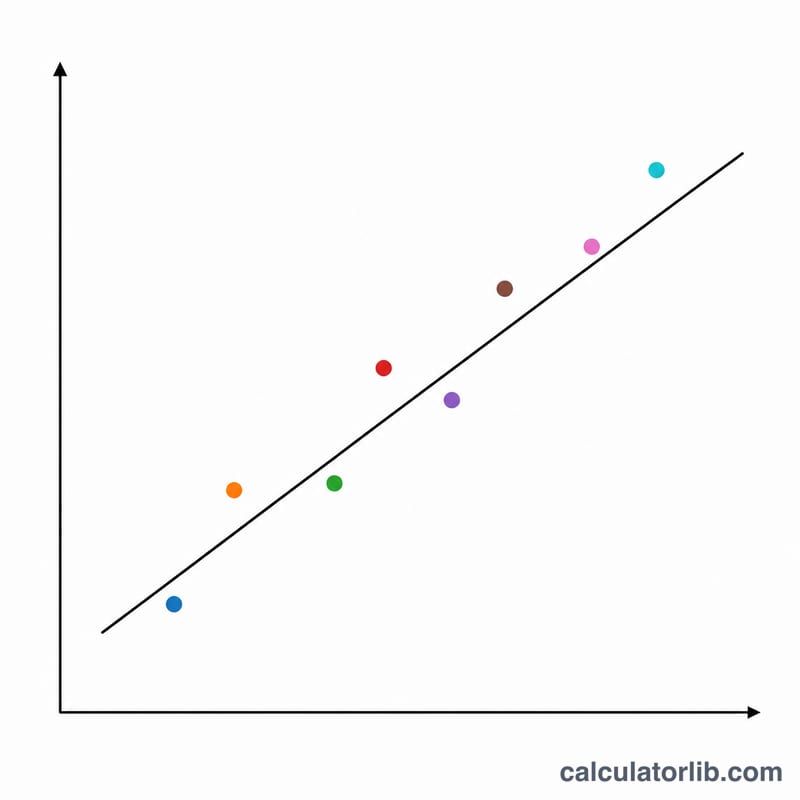
Why does r² matter? r² tells you the fraction of variation in Y that the linear relationship with X explains; an r² of 0.6 means 60% of Y's variance is accounted for.