
What is the Pearson correlation coefficient?
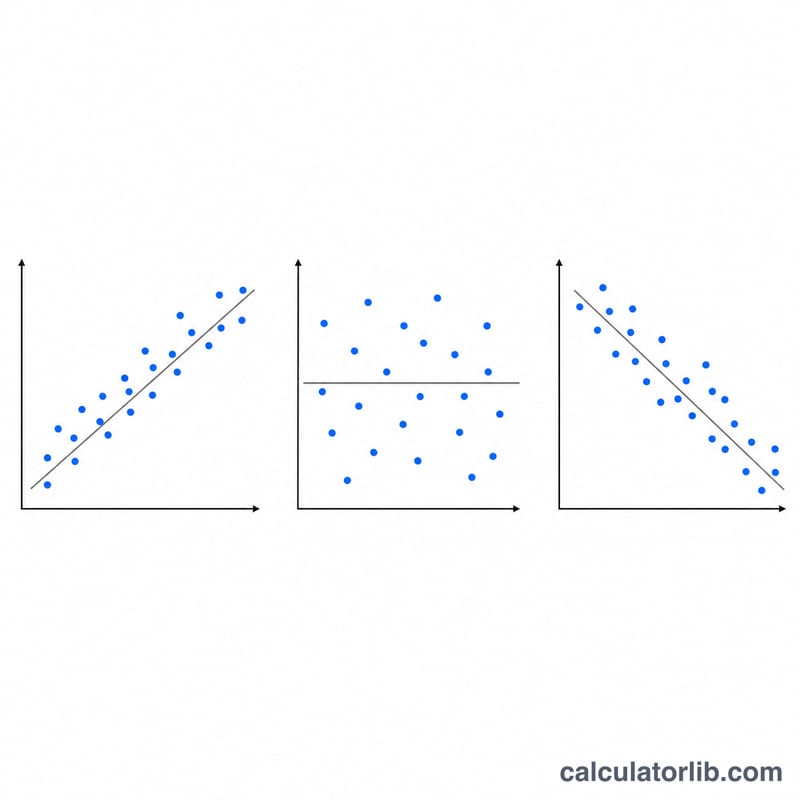
The Pearson correlation coefficient, written as \(r\), measures how strongly two numerical variables move together in a straight-line (linear) fashion. It always falls between -1 and +1. A value near +1 means the variables rise together, near -1 means one rises as the other falls, and near 0 means little or no linear relationship. This tool is universal — it applies to any paired numeric data, in any field.
How to use this calculator
Enter your X values and your Y values, separated by commas or spaces. Each X must be paired with the Y in the same position, so both lists should have the same number of entries. Click calculate to get \(r\), plus the coefficient of determination (\(r^2\)), the least-squares regression slope and intercept, and the covariance.
The formula explained
For each data point you compute the deviation of x from its mean \((x - \bar{x})\) and of y from its mean \((y - \bar{y})\). The numerator sums the products of these deviations. The denominator is the square root of the product of the summed squared deviations of each variable. Dividing standardises the result so it is unit-free and bounded between -1 and +1.
$$ r = \frac{\sum (x_i - \bar{x})(y_i - \bar{y})}{\sqrt{\sum (x_i - \bar{x})^2 \, \sum (y_i - \bar{y})^2}} $$where
$$ \left\{ \begin{aligned} x_i &= \text{X values} \\ y_i &= \text{Y values} \\ \bar{x} &= \tfrac{1}{n}\textstyle\sum x_i,\quad \bar{y} = \tfrac{1}{n}\textstyle\sum y_i \end{aligned} \right. $$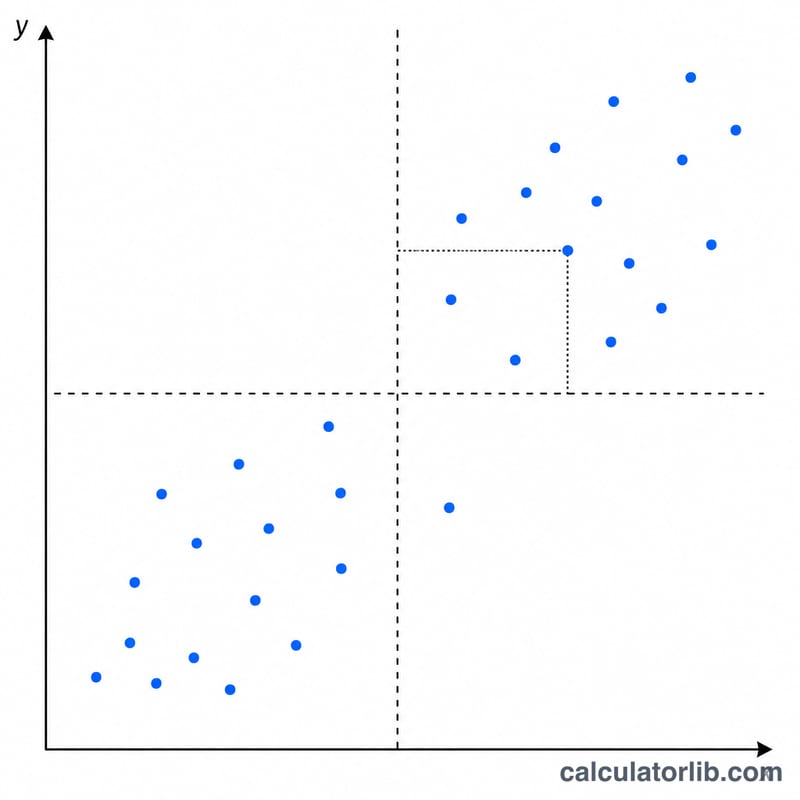
Worked example
Take X = 1, 2, 3, 4, 5 and Y = 2, 4, 5, 4, 5. The means are \(\bar{x} = 3\) and \(\bar{y} = 4\). The sum of cross-products \(\sum (x - \bar{x})(y - \bar{y}) = 6\), \(\sum (x - \bar{x})^2 = 10\), and \(\sum (y - \bar{y})^2 = 6\). So
$$ r = \frac{6}{\sqrt{10 \times 6}} = \frac{6}{\sqrt{60}} \approx 0.7746 $$indicating a fairly strong positive linear relationship.
FAQ
What does \(r^2\) tell me? It is \(r\) squared and represents the fraction of variation in Y explained by the linear relationship with X. An \(r\) of 0.7746 gives \(r^2 \approx 0.6\), meaning about 60% of the variance is explained.
Does correlation prove causation? No. A high \(r\) shows two variables move together but does not establish that one causes the other.
What if \(r\) is exactly 0? There is no linear association, though a non-linear relationship may still exist that Pearson \(r\) cannot detect.