
What is the Coefficient of Variation?
The coefficient of variation (CV), also called the relative standard deviation, measures how much your data varies relative to its mean. Because it is expressed as a percentage, the CV lets you compare the variability of data sets that have different units or very different averages — something a raw standard deviation cannot do.
How to use this calculator
Type your data values into the box, separated by commas or spaces. Choose whether your numbers represent a sample (a subset of a larger group, using n−1) or the entire population (using n). The calculator returns the CV percentage along with the mean and standard deviation used in the computation.
The formula explained
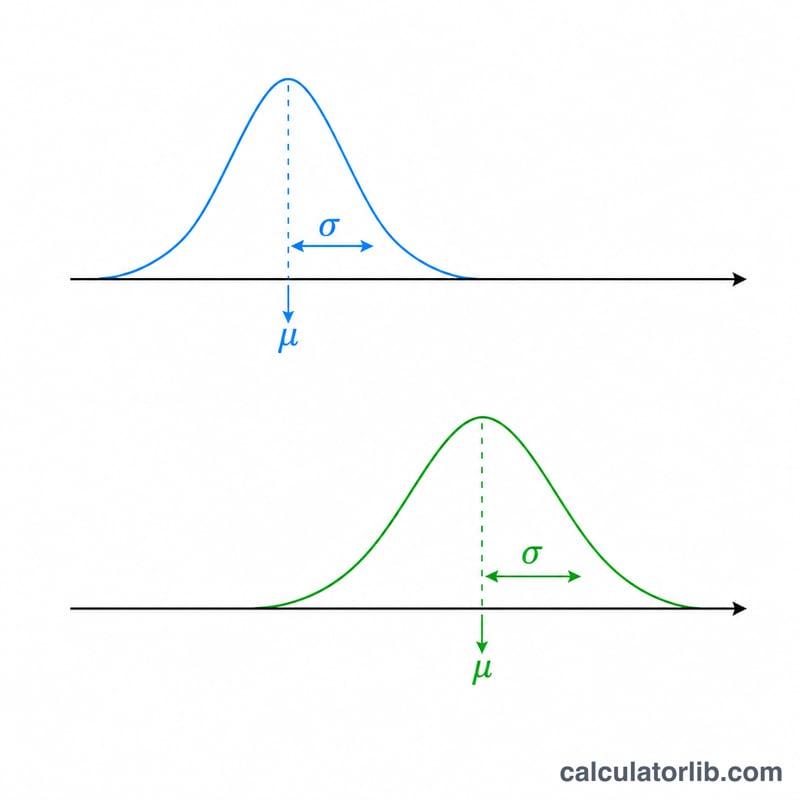
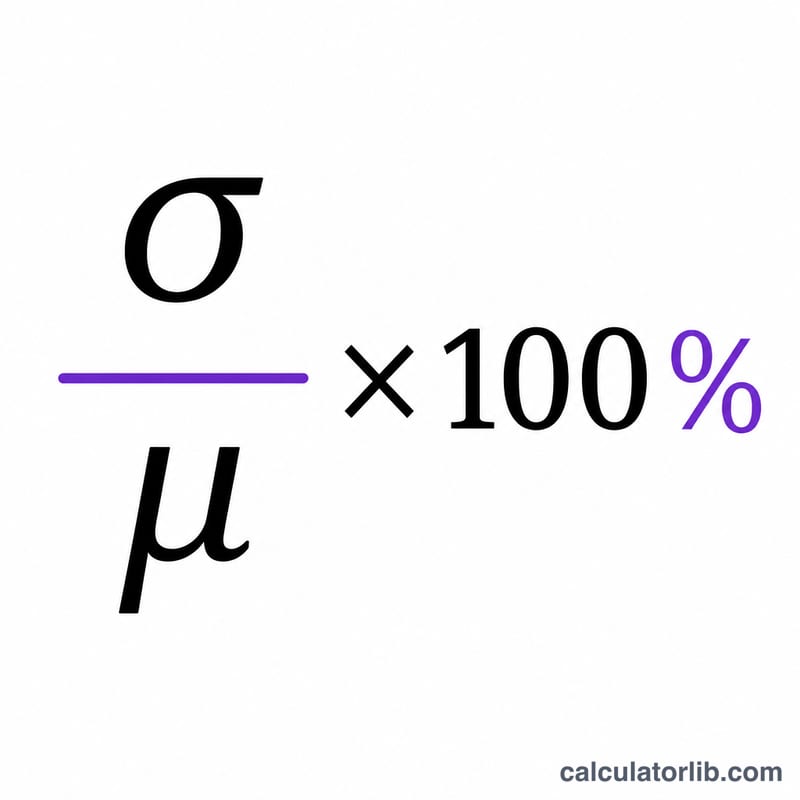
The CV is the standard deviation divided by the mean, multiplied by 100 to give a percentage: $$\text{CV} = \frac{\sigma}{\mu} \times 100\%$$. A lower CV means the data points cluster tightly around the mean; a higher CV means greater relative spread. The CV is only meaningful for data measured on a ratio scale with a non-zero, positive mean.
Worked example
Take the values 2, 4, 4, 4, 5, 5, 7, 9. The mean is \(40 \div 8 = 5\). Treating the data as a population, the variance is \(32 \div 8 = 4\), so the standard deviation is 2. The CV is $$\frac{2}{5} \times 100\% = 40\%.$$ As a sample, the variance becomes \(32 \div 7 \approx 4.571\), the standard deviation \(\approx 2.138\), and the CV \(\approx 42.76\%\).
FAQ
When should I use sample vs population? Use "sample" when your data is a subset drawn to estimate a larger group; use "population" when you have every member of the group.
Can the CV be negative? The standard deviation is always non-negative, so the CV is negative only if the mean is negative. CV is typically used with positive data.
What is a "good" CV? It depends on the field — a CV under 10% often indicates low variability, but acceptable thresholds vary by discipline.