
What Is the Pearson Correlation Coefficient?
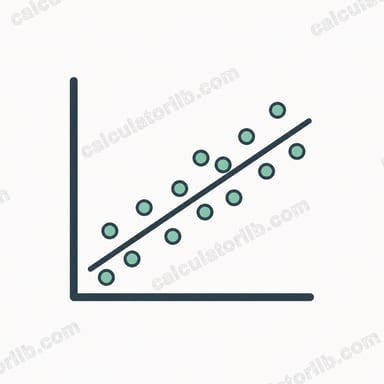
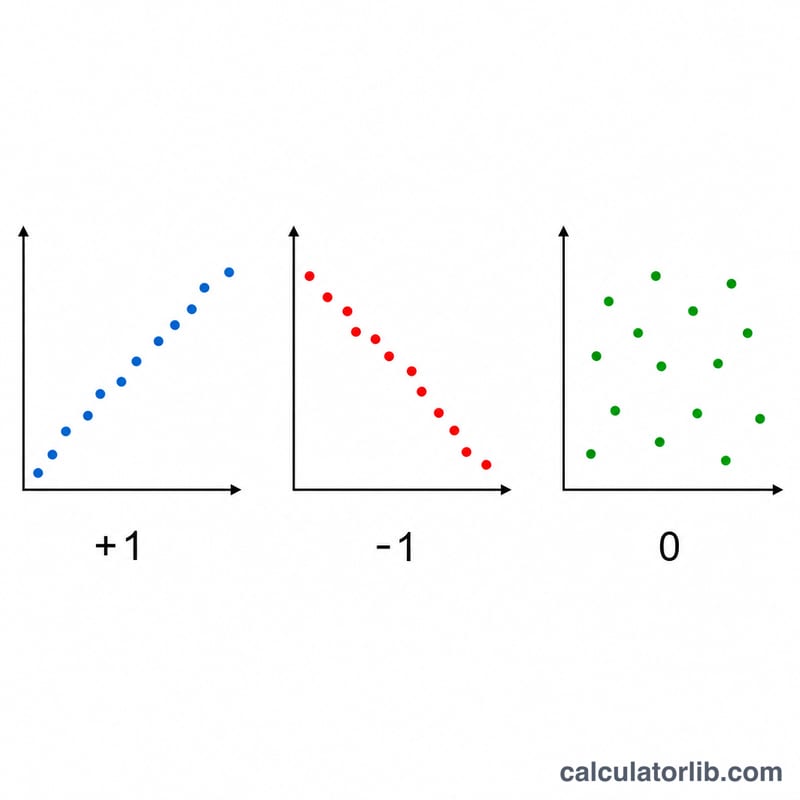
The Pearson correlation coefficient, denoted r, measures the strength and direction of the linear relationship between two numeric variables. Its value always falls between −1 and +1: a value of +1 means a perfect positive linear relationship, −1 means a perfect negative relationship, and 0 means no linear correlation at all. It is one of the most widely used statistics in research, finance, and data science.
How to Use This Calculator
Enter your X values and Y values as comma- or space-separated lists. Each X must pair with the Y in the same position, so both lists should contain the same number of values. The calculator returns r, the coefficient of determination r², the number of paired observations, and the mean of each variable.
The Formula Explained
The formula subtracts each value from its mean to get deviations, multiplies the paired X and Y deviations and sums them (the numerator), then divides by the square root of the product of the summed squared deviations (the denominator):
$$r = \frac{\sum (x_i - \bar{x})(y_i - \bar{y})}{\sqrt{\sum (x_i - \bar{x})^2 \; \sum (y_i - \bar{y})^2}}$$The numerator captures how the variables move together (covariance), while the denominator normalises the result so it stays in the −1 to +1 range.
Worked Example
Suppose X = 1, 2, 3, 4, 5 and Y = 2, 4, 5, 4, 5. The means are \(\bar{x} = 3\) and \(\bar{y} = 4\). The sum of deviation products is 6, \(\sum (x_i - \bar{x})^2 = 10\), and \(\sum (y_i - \bar{y})^2 = 6\). So $$r = \frac{6}{\sqrt{10 \times 6}} = \frac{6}{\sqrt{60}} \approx 0.7746$$ This indicates a strong positive linear relationship, with \(r^2 \approx 0.60\) meaning about 60% of the variance is shared.
FAQ
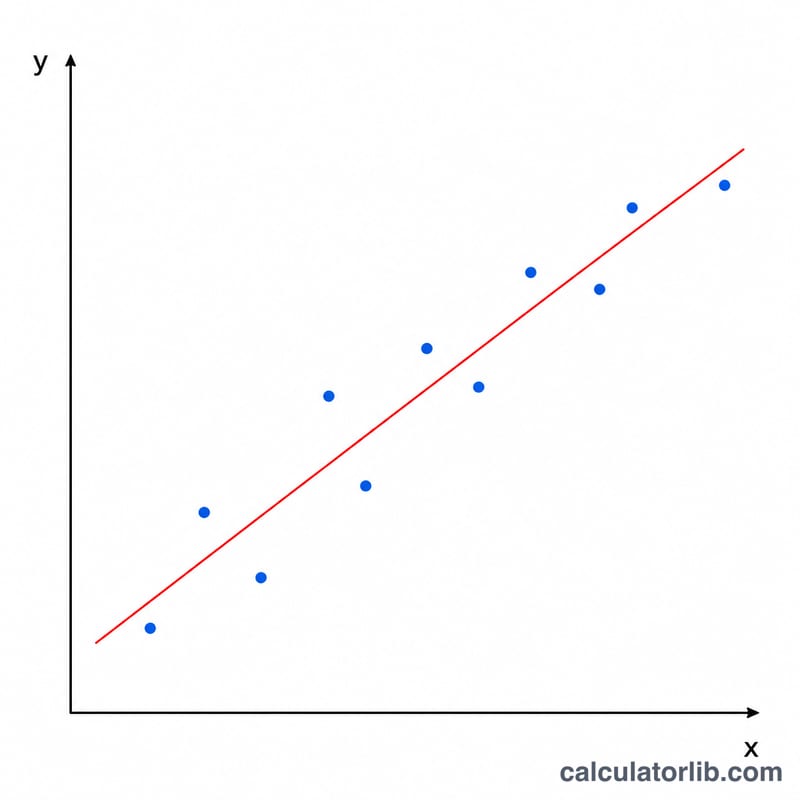
What does r² tell me? r² (r squared) is the proportion of variance in one variable that is predictable from the other — useful for judging how well a linear model fits.
Does a high r mean causation? No. Correlation measures association, not cause. A strong r can arise from coincidence or a hidden third variable.
Why must X and Y have equal length? Pearson's r works on paired observations. If the lists differ in length, only the first n pairs are used, where n is the shorter count.