
What is the Pearson Correlation Coefficient?
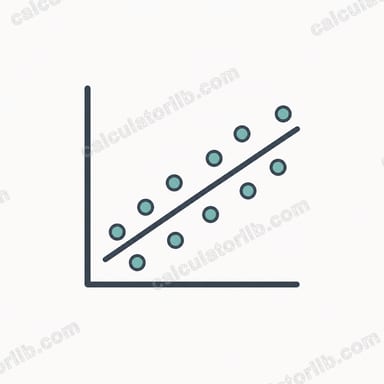
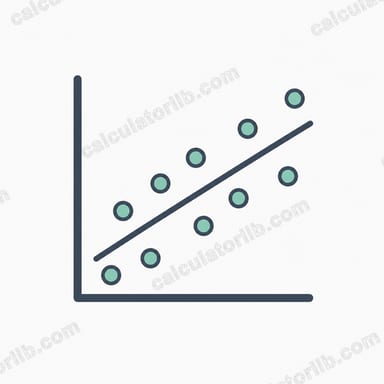
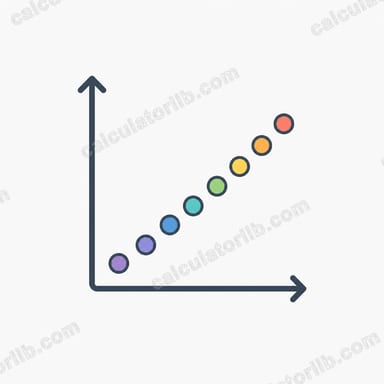
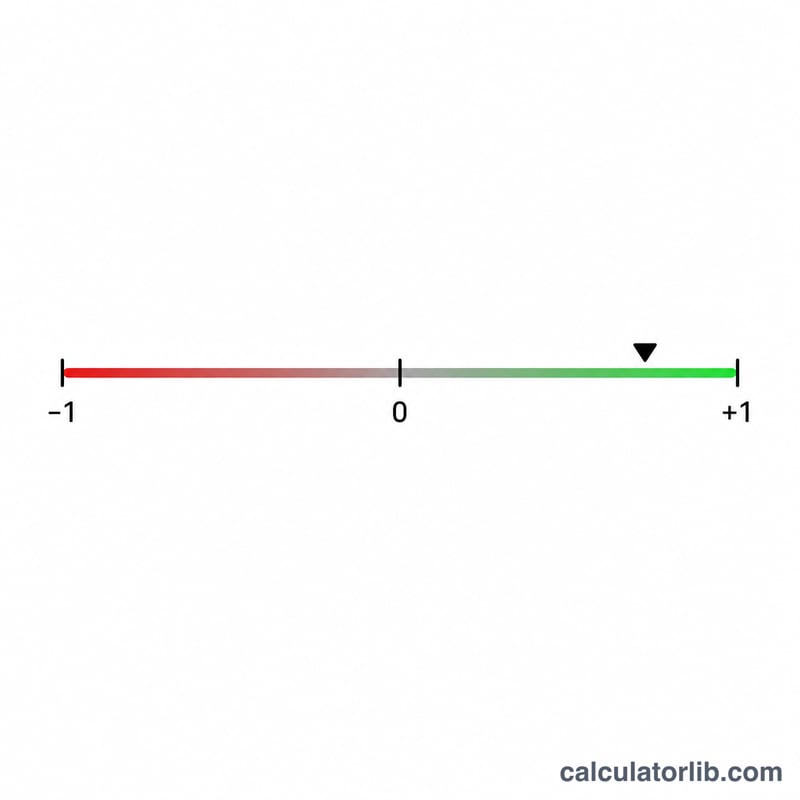
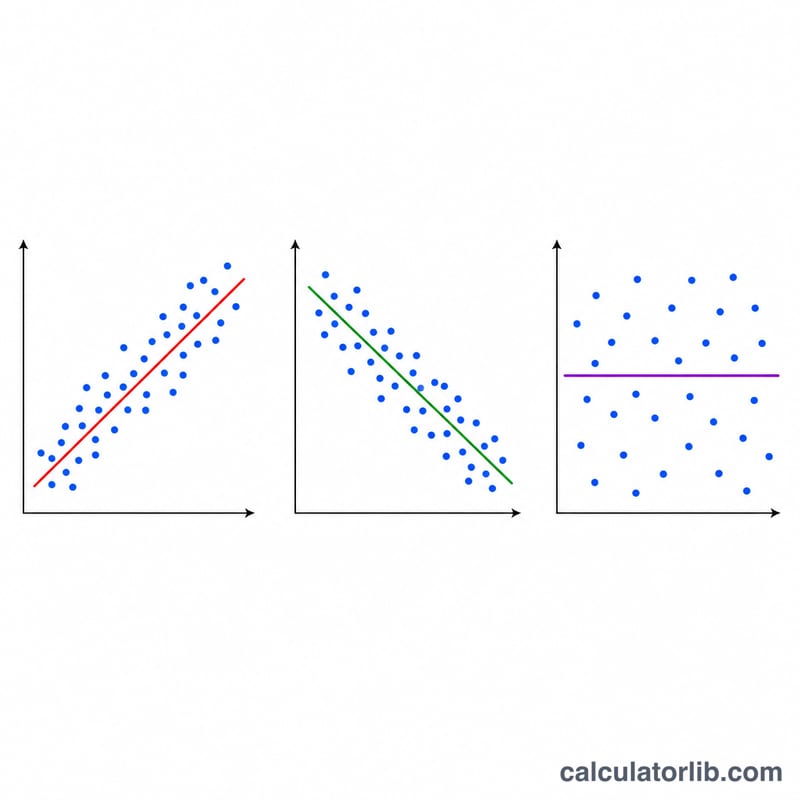
The Pearson correlation coefficient, denoted r, measures the strength and direction of the linear relationship between two numeric variables, X and Y. It always falls between −1 and +1. A value of +1 means a perfect positive linear relationship, −1 means a perfect negative one, and 0 means no linear relationship at all.
How to Use This Calculator
Enter your X values and the matching Y values, separated by commas or spaces. Each X must pair with a Y in the same position, so both lists should have the same number of entries. The calculator returns r, the coefficient of determination r², the number of pairs, and every intermediate sum used in the computation so you can check the work by hand.
The Formula Explained
The computational form used here is:
$$r = \frac{n\sum xy - \sum x \sum y}{\sqrt{\left(n\sum x^2 - \left(\sum x\right)^2\right)\left(n\sum y^2 - \left(\sum y\right)^2\right)}}$$Here \(n\) is the number of data pairs, \(\sum xy\) is the sum of the products of each X and Y, \(\sum x\) and \(\sum y\) are the sums of each variable, and \(\sum x^2\) and \(\sum y^2\) are the sums of the squares. The numerator captures how X and Y vary together (covariance scaled by \(n\)), while the denominator normalizes by the spread of each variable.
Worked Example
Take X = 1, 2, 3, 4, 5 and Y = 2, 4, 5, 4, 5. Then \(n = 5\), \(\sum x = 15\), \(\sum y = 20\), \(\sum xy = 66\), \(\sum x^2 = 55\), \(\sum y^2 = 86\). The numerator is \(5\cdot 66 - 15\cdot 20 = 330 - 300 = 30\). The denominator is $$\sqrt{(5\cdot 55 - 225)(5\cdot 86 - 400)} = \sqrt{50 \cdot 30} = \sqrt{1500} \approx 38.7298.$$ So \(r \approx 30 / 38.7298 \approx 0.7746\), a strong positive correlation.
FAQ
What does r² tell me? The coefficient of determination, \(r^2\), is the proportion of variance in one variable explained by a linear fit with the other. In the example above \(r^2 \approx 0.60\), so about 60% of the variation is explained.
Does correlation imply causation? No. A high r only indicates two variables move together linearly; it does not prove one causes the other.
What if my lists are different lengths? Only the first \(n\) pairs (the length of the shorter list) are used, so make sure your data is properly aligned.