
什麼是相關係數?
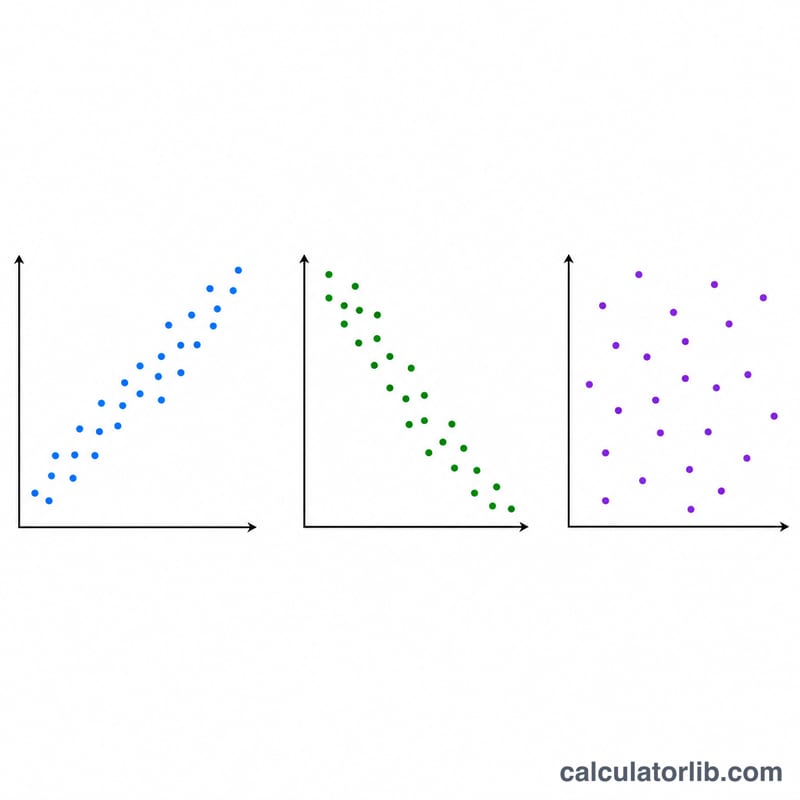
皮爾森相關係數通常以 r 表示,用來衡量兩個變數之間「直線關係」的強弱程度。它的值一定落在 −1 到 +1 之間。當 r 接近 +1,代表兩者呈現強烈的正向線性關係(X 增加時 Y 也跟著增加);接近 −1 則代表強烈的負向關係;接近 0 則表示兩者幾乎沒有線性關係。
如何使用這個計算器
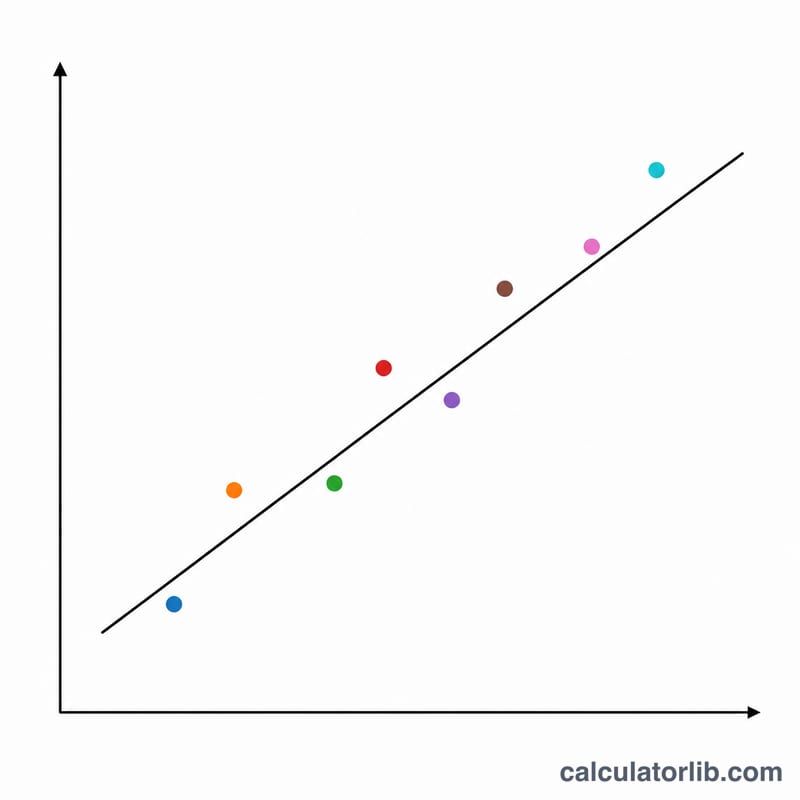
請輸入你的 X 數值,以及對應的 Y 數值,每組數值之間以逗號或空格分隔。兩組數列的資料筆數應該相同;若不一致,計算器只會採用前面能成對的部分。計算結果會包含 r、判定係數 r²、共變異數、各組數據的平均值,以及最適迴歸直線的斜率與截距。
公式說明
對每一組成對數據,先算出 x 與其平均值的離差(x − x̄),以及 y 與其平均值的離差(y − ȳ)。分子是把這些離差兩兩相乘後加總;分母則是各自離差平方和相乘後再開根號。透過這樣的標準化,結果會被限制在 −1 到 +1 之間,因此 r 的大小不會受到測量單位的影響。
$$r = \frac{\sum (x_i - \bar{x})(y_i - \bar{y})}{\sqrt{\sum (x_i - \bar{x})^2 \; \sum (y_i - \bar{y})^2}}$$ $$\text{where}\quad \left\{ \begin{aligned} x_i &= \text{X values} \\ y_i &= \text{Y values} \\ \bar{x} &= \tfrac{1}{n}\textstyle\sum x_i \\ \bar{y} &= \tfrac{1}{n}\textstyle\sum y_i \end{aligned} \right.$$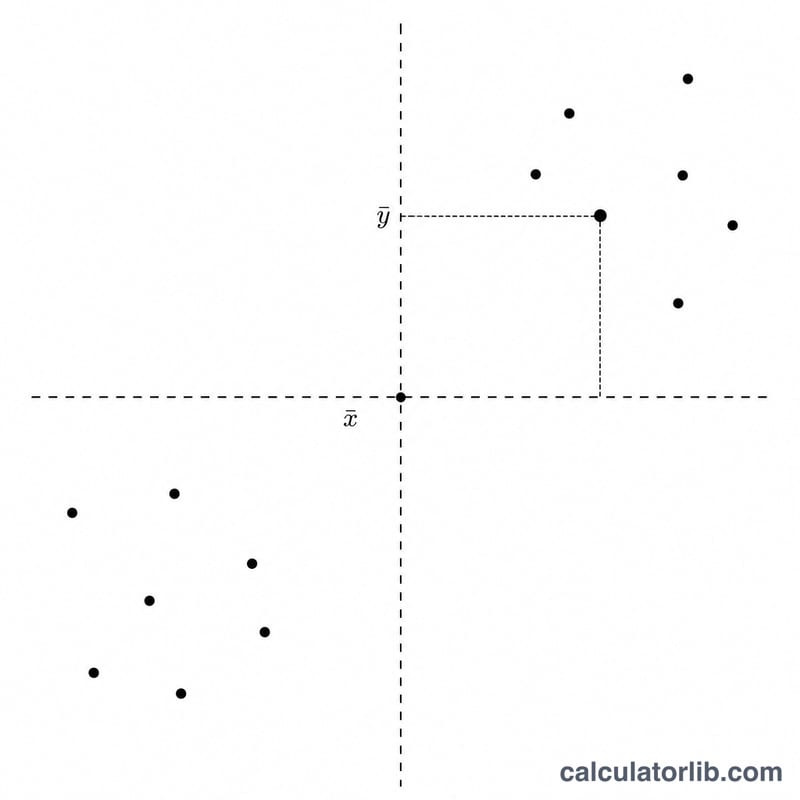
範例試算
假設 X = 1, 2, 3, 4, 5,Y = 2, 4, 5, 4, 5。兩組的平均值分別為 \(\bar{x} = 3\)、\(\bar{y} = 4\)。離差乘積的總和為 6,\(\sum (x-\bar{x})^2 = 10\),\(\sum (y-\bar{y})^2 = 6\)。因此 $$r = \frac{6}{\sqrt{10 \times 6}} = \frac{6}{\sqrt{60}} \approx 0.7746$$ 對應的 \(r^2 \approx 0.6\)。這表示兩者具有相當明顯的正向線性關係。
常見問題
有相關就代表有因果關係嗎?不是。r 很高只說明兩個變數會一起變動,並不能證明其中一個是造成另一個變化的原因。
怎樣才算「強」的相關?一般可粗略參考:\(|r|\) 大於 0.7 屬於強相關,0.3 至 0.7 屬於中度相關,低於 0.3 則偏弱——但實際仍須視情境而定。
為什麼 r² 很重要?r² 告訴你 Y 的變異中,有多少比例可以用它與 X 之間的線性關係來解釋;r² 為 0.6 就代表 Y 的變異有 60% 能由此關係說明。