What Is a One-Sample t-Test?
A one-sample t-test checks whether the mean of a single sample differs significantly from a known or hypothesized population mean (\(\mu_0\)). It is widely used when the population standard deviation is unknown and the sample is reasonably small. This calculator computes the test statistic t, the degrees of freedom, and the standard error of the mean.
How to Use It
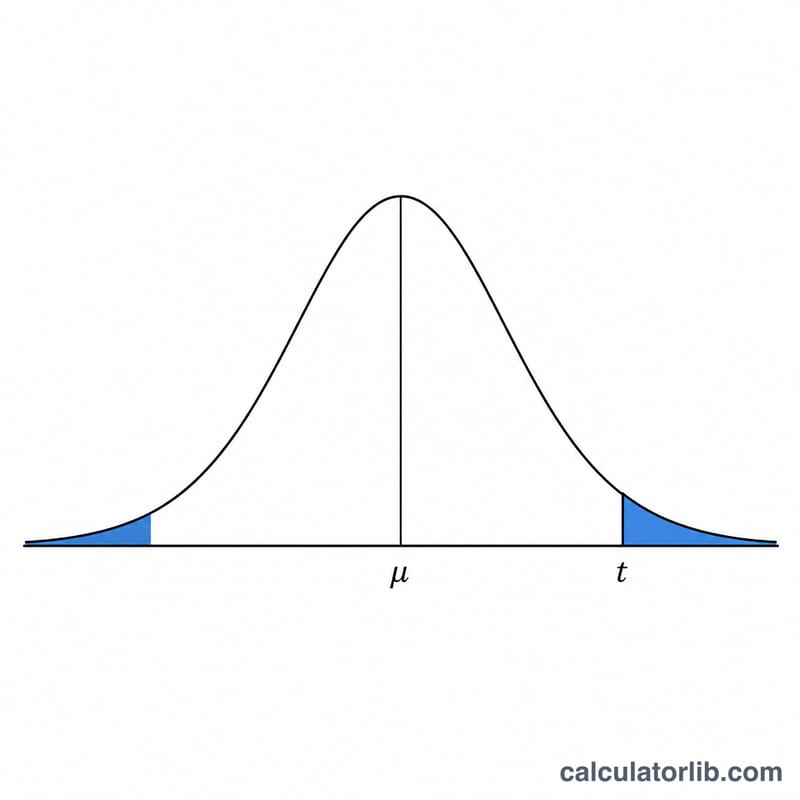
Enter your sample mean (\(\bar{x}\)), the hypothesized population mean (\(\mu_0\)), the sample standard deviation (\(s\)), and the sample size (\(n\)). The calculator returns the t-statistic. Compare its absolute value to the critical t-value for your chosen significance level (e.g. \(\alpha = 0.05\)) and \(df = n - 1\), or convert it to a p-value, to decide whether to reject the null hypothesis.
The Formula Explained
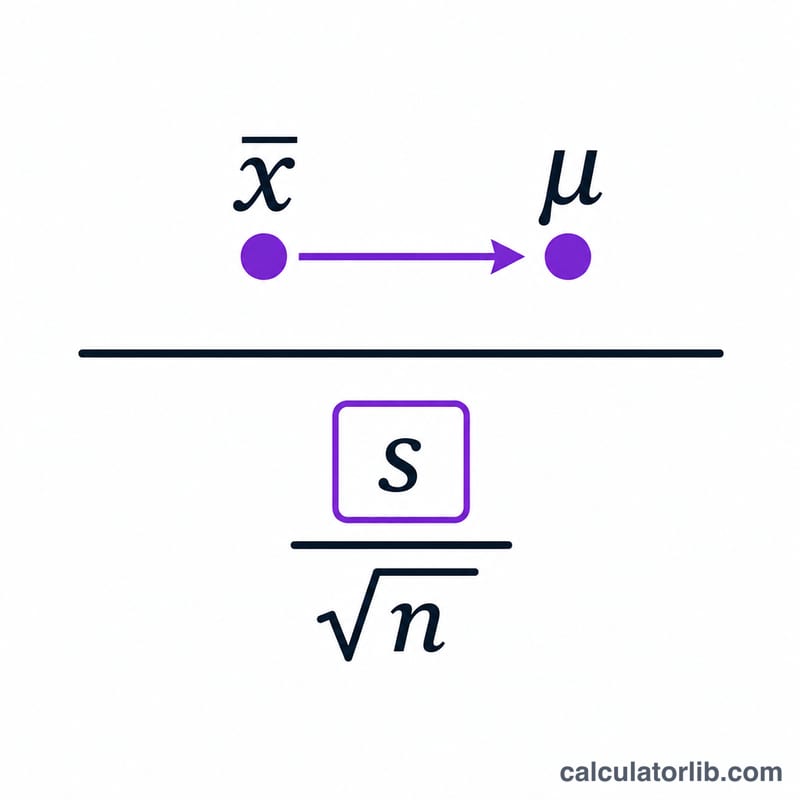
The statistic is $$t = \dfrac{\text{Sample Mean} - \text{Population Mean}}{\text{Std Dev} \big/ \sqrt{\text{Sample Size}}}$$ The numerator measures how far the sample mean sits from the hypothesized mean. The denominator, the standard error, scales that difference by the sampling variability. A larger \(|t|\) indicates the sample mean is further from \(\mu_0\) relative to noise, making it more likely the difference is real.
Worked Example
Suppose \(\bar{x} = 10.5\), \(\mu_0 = 10\), \(s = 2\), and \(n = 25\). The standard error is \(2/\sqrt{25} = 2/5 = 0.4\). Then $$t = \frac{10.5 - 10}{0.4} = \frac{0.5}{0.4} = 1.25$$ with \(df = 24\). Comparing \(1.25\) to the critical value \(t_{0.025,\,24} \approx 2.064\), we fail to reject the null hypothesis.
FAQ
When should I use a one-sample t-test? When you have one continuous sample and want to compare its mean to a single fixed reference value, and the population standard deviation is unknown.
What are the assumptions? The data should be approximately normally distributed (or \(n\) large enough), and observations should be independent.
How do I get a p-value? Use the computed \(t\) and \(df\) with a t-distribution table or statistical software to find the corresponding two-tailed or one-tailed p-value.


