
What the Normal Distribution Calculator Does
The normal distribution (also called the Gaussian or bell curve) describes how many natural and statistical quantities — heights, test scores, measurement errors — cluster symmetrically around an average. This calculator takes a single point on that curve and tells you three things at once: the probability density at your X value, the cumulative probability up to it, and its z-score. You only need three inputs to get started.
- Mean (μ): the centre of the distribution, where the curve peaks.
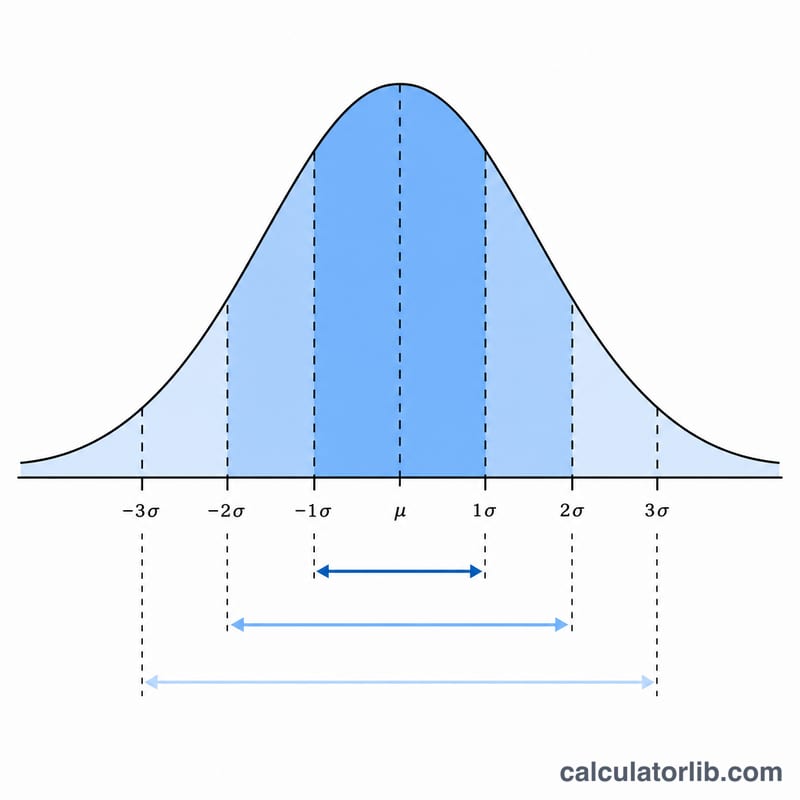
- Standard Deviation (σ): how spread out the data is. This must be greater than 0.
- X Value: the specific point on the distribution you want to evaluate.
The Formula Behind It
The probability density function (PDF) is:
f(x) = (1 / (σ√(2π))) · e^(−½((x−μ)/σ)²)
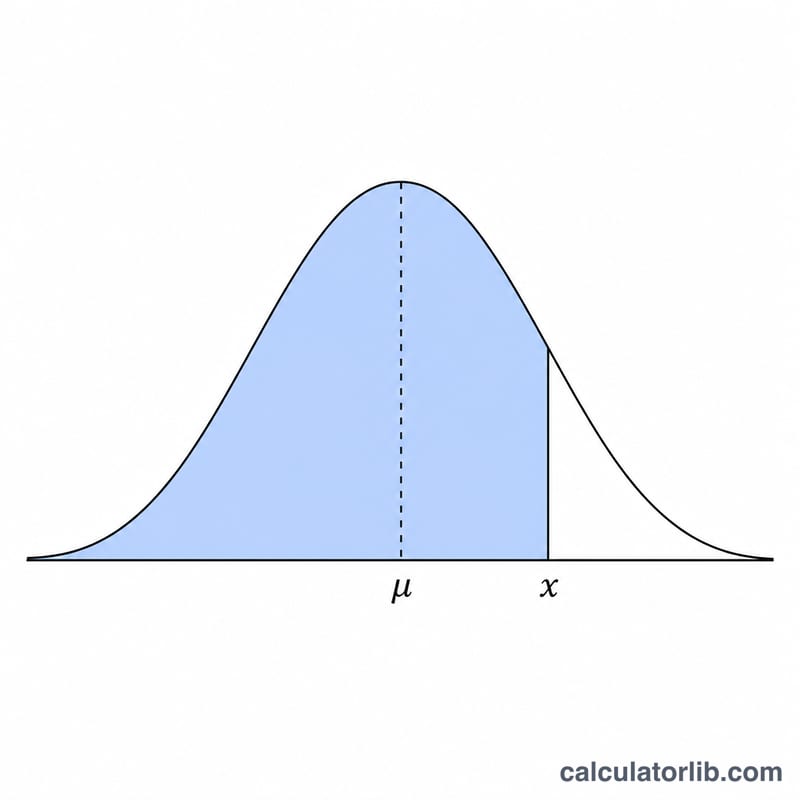
The calculator evaluates this PDF at your X value, computes the cumulative distribution function (CDF) — the area under the curve from −∞ up to X, i.e. the probability of a value being less than or equal to X — and finds the z-score using:
- z = (x − μ) / σ — how many standard deviations X sits from the mean.
It also plots the bell curve across μ ± 4σ so you can see exactly where your X value falls.
Worked Example
Suppose exam scores have a Mean (μ) of 70 and a Standard Deviation (σ) of 10, and you want to evaluate an X value of 85.
- Z-score: (85 − 70) / 10 = 1.5
- PDF f(85): ≈ 0.0130 — the height of the curve at 85.
- CDF: ≈ 0.9332 — meaning about 93.3% of scores fall at or below 85, so roughly 6.7% scored higher.
This instantly tells you that a score of 85 is in the top 7% of the class.
Frequently Asked Questions
What is the difference between PDF and CDF? The PDF gives the relative likelihood (height of the curve) at one exact point, while the CDF gives the accumulated probability of all values up to and including X. For probabilities you usually want the CDF.
Why must the standard deviation be greater than 0? A standard deviation of zero would mean no variation at all, making the formula divide by zero. The distribution only makes sense with a positive spread.
How do I find the probability above my X value? Subtract the CDF from 1. In the example above, P(X > 85) = 1 − 0.9332 = 0.0668, or about 6.7%.