What is the Normal Distribution Probability Calculator?
This calculator finds the probability that a normally distributed random variable falls below or above a given value. Given a value x, a mean μ, and a standard deviation σ, it returns the cumulative probability \(P(X < x)\) and the upper-tail probability \(P(X > x)\), along with the corresponding z-score. The normal (Gaussian) distribution is the foundation of countless statistical tests, quality-control charts, and risk models.
How to use it
Enter the value you are interested in (x), the distribution's mean (μ), and its standard deviation (σ, which must be positive). The tool standardizes your value into a z-score, then evaluates the standard normal cumulative distribution function (CDF) to express the result as a percentage.
The formula explained
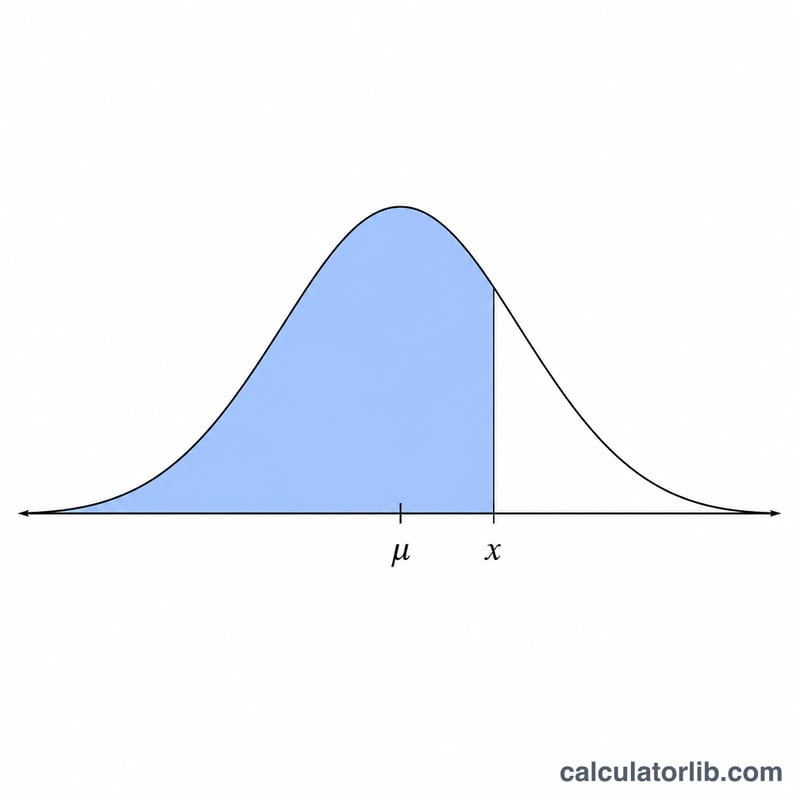
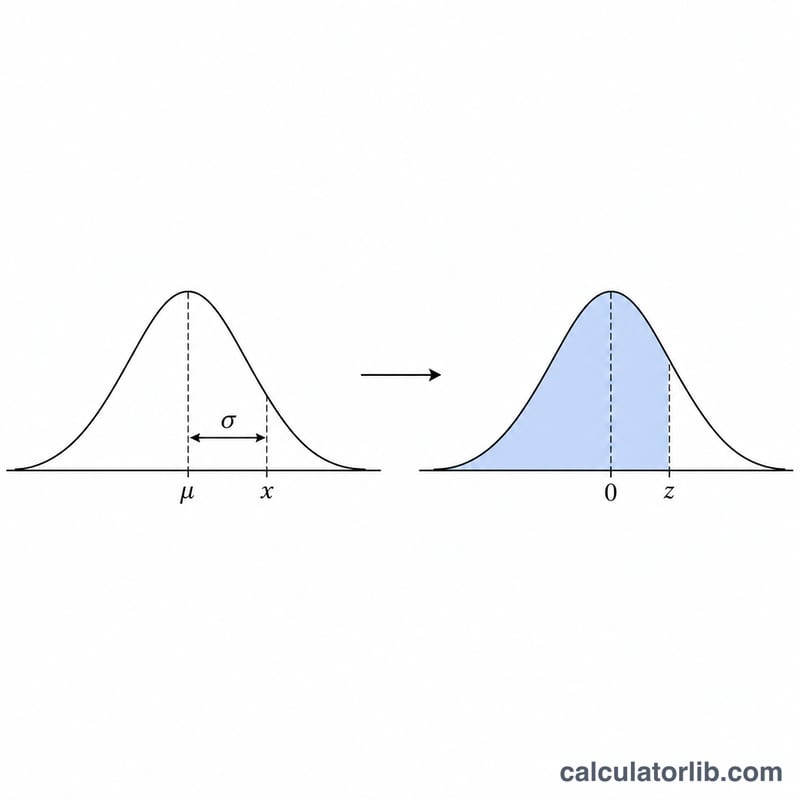
First the value is converted to a z-score: \(z = (x - \mu) / \sigma\). The z-score measures how many standard deviations x sits from the mean. The probability below x is then the standard normal CDF
$$P(XBecause the error function erf has no closed form, this calculator uses the well-known Abramowitz & Stegun 7.1.26 polynomial approximation, accurate to about \(1\times10^{-7}\).
Worked example
Suppose test scores are normally distributed with \(\mu = 100\) and \(\sigma = 15\), and you want \(P(\text{score} < 130)\). The z-score is
$$z=\frac{130 - 100}{15} = 2$$The standard normal CDF at \(z = 2\) is about \(0.97725\), so roughly 97.72% of scores fall below 130, and about 2.28% exceed it.
FAQ
What does the z-score mean? It is the number of standard deviations a value lies away from the mean; positive is above, negative is below.
How do I get the probability between two values? Compute \(P(X < b) - P(X < a)\) by running the calculator twice.
How accurate is the result? The erf approximation is accurate to roughly 7 decimal places, more than enough for typical statistics work.