What this calculator does
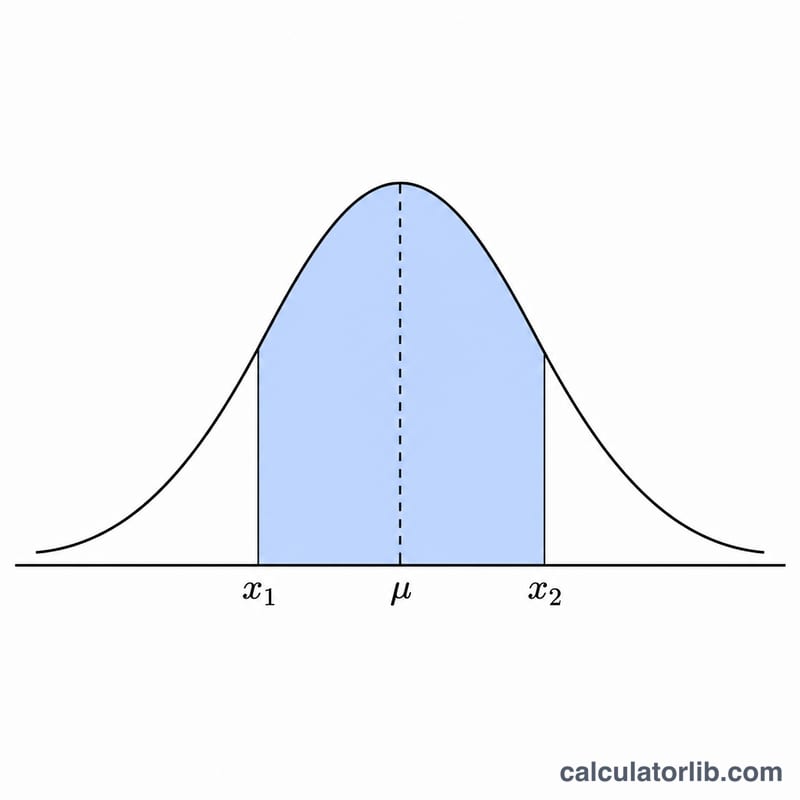
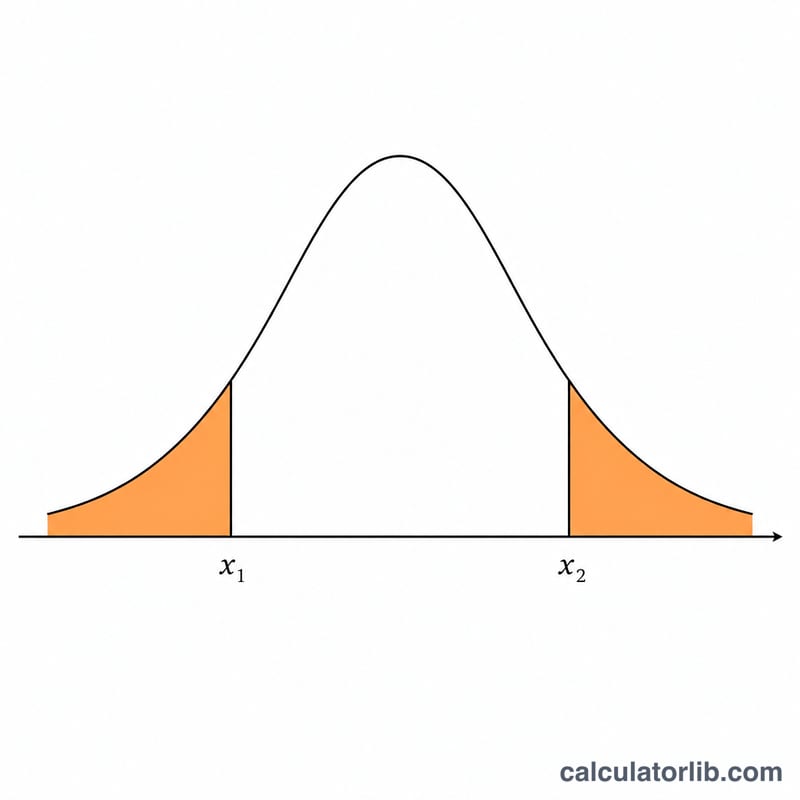
This tool works with a normal (Gaussian) distribution \(N(\mu, \sigma^2)\) described by its mean \(\mu\) and standard deviation \(\sigma\). Given two points x1 and x2, it returns four numbers: the probability density f(x1) and f(x2) at each point, the inner cumulative probability \(P(\text{x}_1 \le X \le \text{x}_2)\) (the area between the two points), and the outer cumulative probability in the two tails, which equals 1 minus the inner area. It is a pure-math statistics tool with no regional rules and applies anywhere.
How to use it
Enter the two points x1 and x2 (the calculator automatically uses the smaller one as the lower bound), then the mean \(\mu\) and standard deviation \(\sigma\). The defaults \(\mu=0\) and \(\sigma=1\) give the standard normal distribution, where x-values are simply z-scores. The standard deviation must be greater than zero.
The formula explained
Each point is converted to a z-score \(z = (x - \mu) / \sigma\). The density uses $$f(x) = \frac{1}{\sigma\sqrt{2\pi}}\; e^{-\frac{\left(x - \mu\right)^2}{2\,\sigma^2}}$$ The cumulative area uses the standard normal CDF $$\Phi(z) = \tfrac{1}{2}\left(1 + \operatorname{erf}\!\left(\tfrac{z}{\sqrt{2}}\right)\right)$$ since Java has no built-in erf, the Abramowitz & Stegun 7.1.26 approximation (accuracy ~1e-7) is used. The inner probability is $$P(\,\text{x}_1 \le X \le \text{x}_2\,) = \Phi(z_2) - \Phi(z_1)$$ and the outer probability is $$P_{\text{outer}} = 1 - \Big(\Phi(z_2) - \Phi(z_1)\Big), \quad z_i = \frac{\text{x}_i - \mu}{\sigma}$$
Worked example
Standard normal, x1 = −1, x2 = 1, \(\mu = 0\), \(\sigma = 1\). Densities $$f(-1) = f(1) = 0.398942 \times e^{-0.5} = 0.241971$$ \(\Phi(1) = 0.841345\) and \(\Phi(-1) = 0.158655\), so the inner probability is $$0.841345 - 0.158655 = 0.682690$$ (about 68.27%, the familiar \(\pm 1\sigma\) rule) and the outer probability is 0.317310 (about 31.73%).
FAQ
What if I enter x1 greater than x2? The two values are swapped internally so the inner region is always the interval between the smaller and larger value.
What does \(\mu=0\), \(\sigma=1\) mean? That is the standard normal distribution, so your x-values are read directly as z-scores.
Why is f(x) sometimes above 1? A probability density is not a probability; for small \(\sigma\) the peak height can exceed 1 while the total area still equals 1.