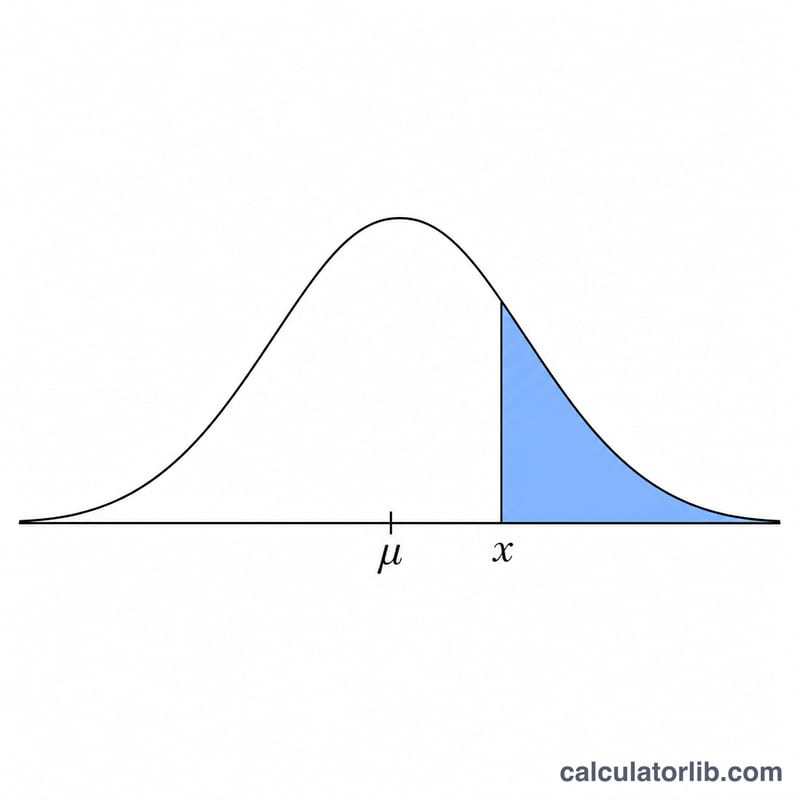
What this calculator does
This tool computes the right-tail probability \(P(X > x)\) for a normally distributed variable. Given a value x, the population mean μ, and the standard deviation σ, it tells you the chance that a randomly drawn observation will be larger than x. It also reports the standardized z-score and the complementary left-tail probability \(P(X \le x)\). This is a universal statistics tool and applies anywhere — quality control, test scores, finance, and lab measurements.
How to use it
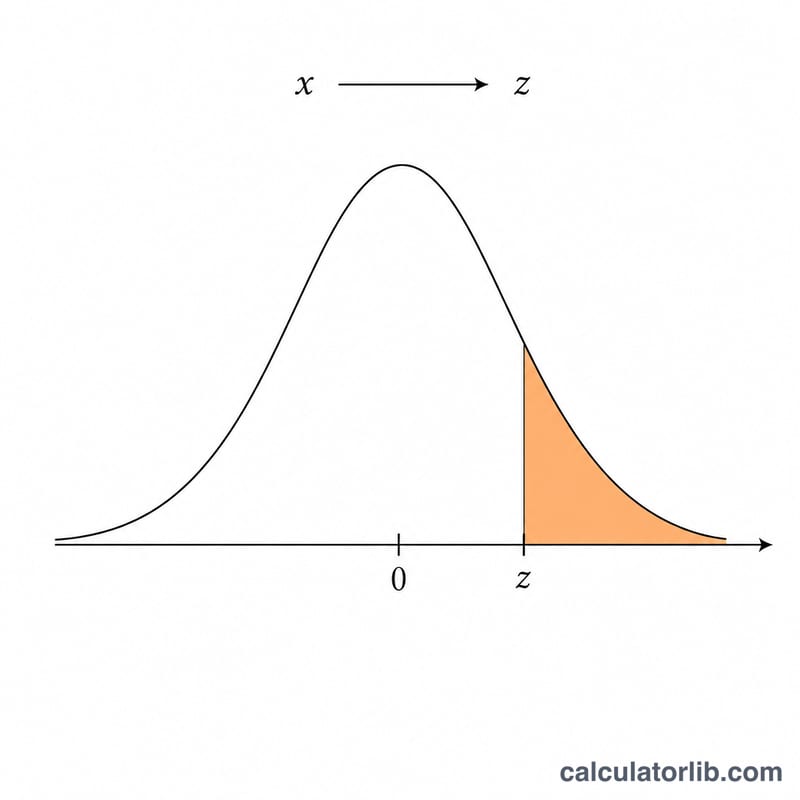
Enter the value of interest (x), the distribution mean (μ), and the standard deviation (σ, which must be positive). The calculator standardizes your value into a z-score and evaluates the standard normal cumulative distribution function Φ to find both tails. Read off the probability that X exceeds x, expressed both as a decimal and as a percentage.
The formula explained
First convert x to a z-score: \(z = (x - \mu) / \sigma\). The function \(\Phi(z)\) gives the area under the standard normal curve to the left of z, i.e. \(P(X \le x)\). Because total area equals 1, the right tail is simply $$P(X > x) = 1 - \Phi(z).$$ This calculator evaluates Φ using a high-accuracy error-function approximation (Abramowitz & Stegun 7.1.26), which is accurate to about 7 decimal places.
Worked example
Suppose adult heights are normal with μ = 170 cm and σ = 10 cm, and you want P(height > 185). Then $$z = (185 - 170)/10 = 1.5.$$ From the standard normal table, \(\Phi(1.5) \approx 0.93319\), so $$P(X > 185) = 1 - 0.93319 \approx 0.06681,$$ or about 6.68%.
FAQ
What if I want \(P(X < x)\) instead? That is the left tail, shown in the results table as \(P(X \le x) = \Phi(z)\). For a continuous distribution \(P(X < x)\) equals \(P(X \le x)\).
Why must σ be positive? The standard deviation measures spread and must be greater than zero; a value of zero or below has no valid normal distribution.
How accurate is the result? The Φ approximation is accurate to roughly seven decimal places, which is more than enough for typical statistical work.