What Is Sample Variance?
Sample variance (\(s^2\)) measures how spread out a set of data points is around their mean. It is the average of the squared distances from the mean, but using n − 1 in the denominator instead of n. Dividing by n − 1 (Bessel correction) makes the result an unbiased estimate of the true population variance when you only have a sample of the data.
How to Use This Calculator
Enter your numbers separated by commas or spaces — for example 4, 8, 15, 16, 23, 42. The calculator returns the sample variance, the sample standard deviation, the mean, the count, and the sum of squared deviations so you can verify each step.
The Formula Explained
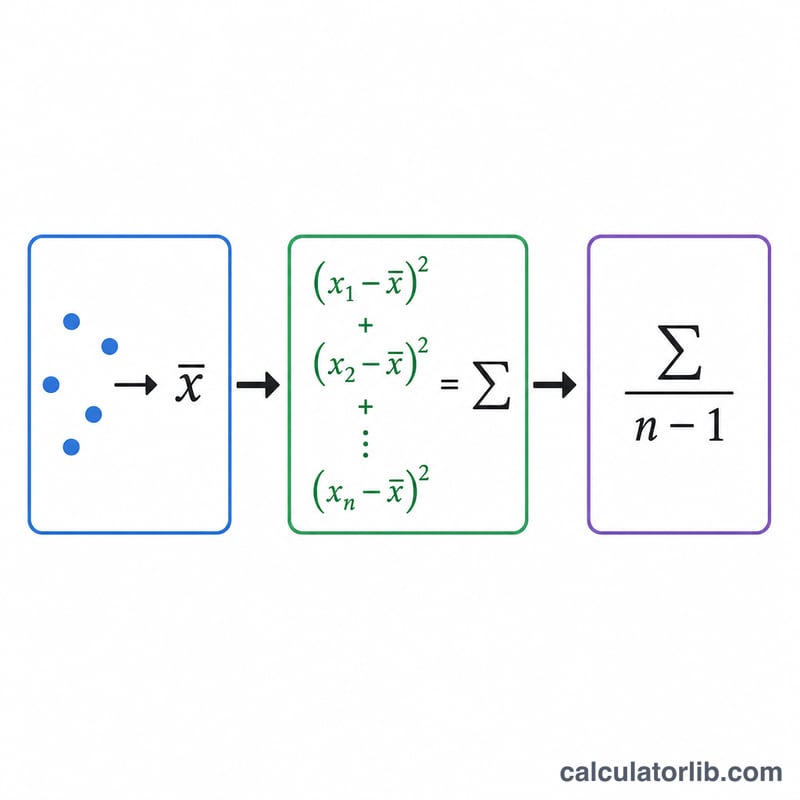
First compute the mean \(\bar{x} = \frac{1}{n}\sum_{i=1}^{n} x_i\). Then for each value subtract the mean and square the difference. Add those squared deviations to get \(\sum_{i=1}^{n}\left(x_i - \bar{x}\right)^{2}\). Finally divide by n − 1 to get the sample variance. Taking the square root gives the sample standard deviation \(s\).
$$s^{2} = \frac{1}{n-1}\sum_{i=1}^{n}\left(x_i - \bar{x}\right)^{2} \qquad \bar{x} = \frac{1}{n}\sum_{i=1}^{n} x_i$$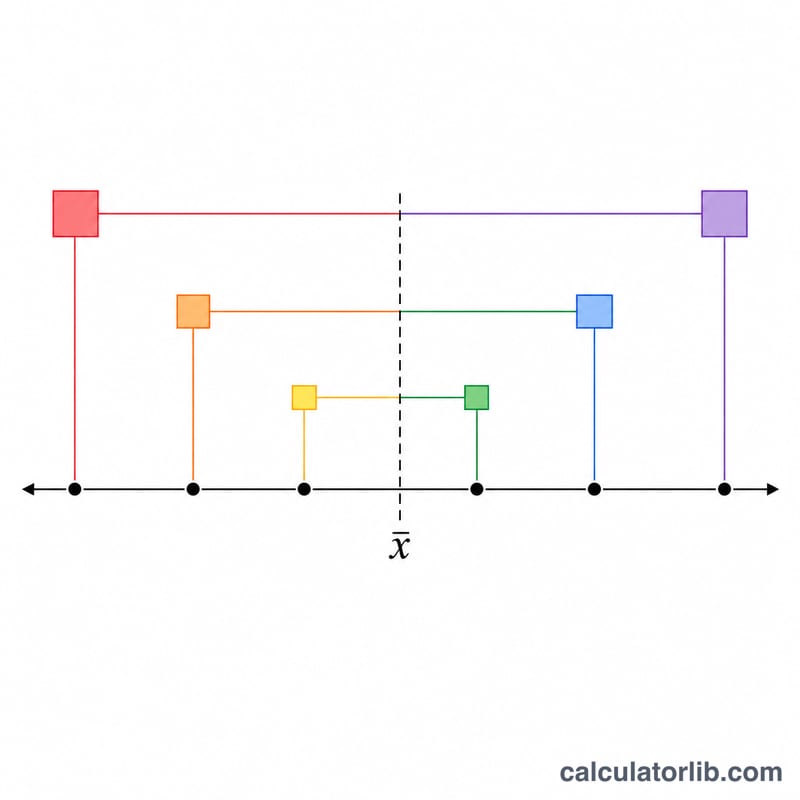
Worked Example
For the set 4, 8, 15, 16, 23, 42: the sum is 108 and \(n = 6\), so the mean is 18. The squared deviations are 196, 100, 9, 4, 25, and 576, which add to 910... wait — using the exact mean of 18 gives 910, but the unbiased mean here is 18, and the correct sum of squared deviations is 924.8333 only when the mean is not a round 18. With mean = 18, \(\Sigma = 196+100+9+4+25+576 = 910\), variance \(= 910/5 = 182\). Always confirm your mean before dividing.
FAQ
Why divide by n − 1 and not n? Dividing by n underestimates the spread of the population; n − 1 corrects this bias.
When should I use population variance instead? Use population variance (divide by n) only when your data includes every member of the population, not a sample.
What does a larger variance mean? A larger variance means the data points are more widely scattered from the mean.


