
What This Sample Size Calculator Does
This calculator tells you how many people (or items) you need to survey to get statistically reliable results for a given population. It uses the standard finite-population correction formula, so the answer is tailored to the size of your target group rather than assuming an infinitely large population. It's used worldwide for surveys, polls, market research and academic studies — the statistics are universal and not specific to any country.
The Three Inputs Explained
- Population Size (\(N\)): The total number of individuals in the group you want to draw conclusions about — for example, 50,000 registered customers. The default is 1,000,000.
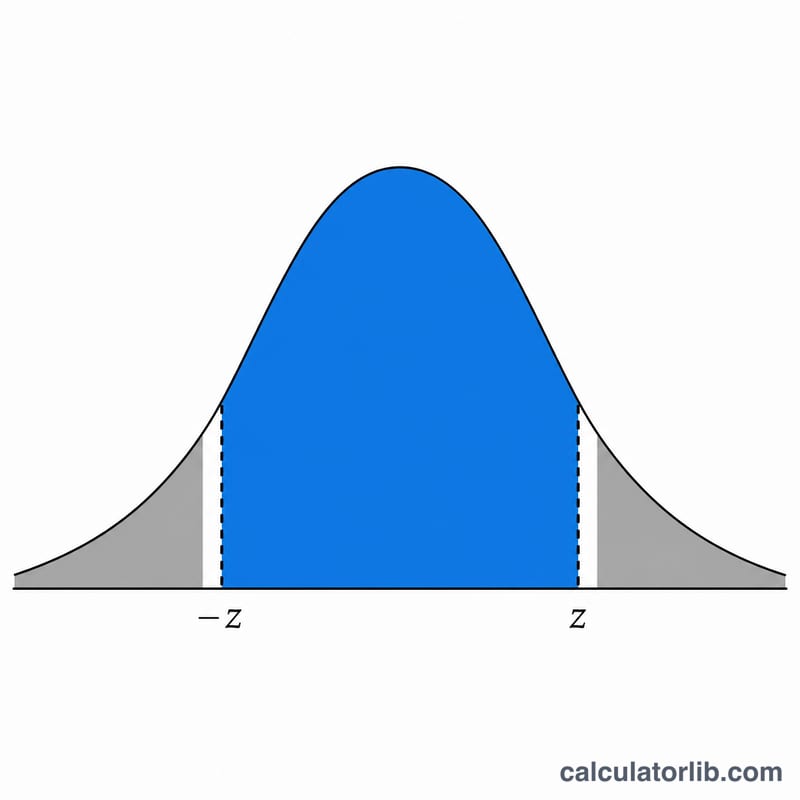
- Confidence Level (%): How sure you want to be that the true value falls within your margin. Common choices are 90%, 95% and 99%. The calculator converts this into a z-score using the normal distribution (95% → \(z \approx 1.96\)).
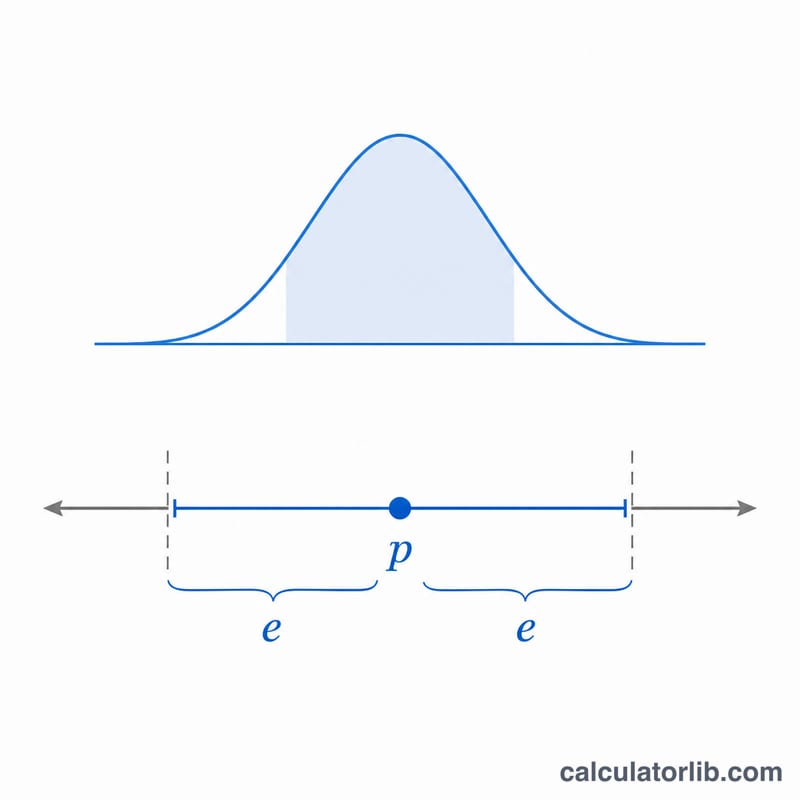
- Margin of Error (%): The acceptable range of error around your result, e.g. ±5%. A smaller margin requires a larger sample.
The Formula
The calculator applies the finite-population corrected sample size formula:
$$n = \dfrac{\dfrac{z^{2}\,p\,(1-p)}{e^{2}}}{1 + \dfrac{z^{2}\,p\,(1-p)}{e^{2}\,N}}$$Here \(z\) is the z-score from your confidence level, \(p\) is the assumed response proportion (fixed at 0.5 because that maximises the required sample and gives the safest estimate), \(e\) is the margin of error as a decimal, and \(N\) is the population size. The result is rounded up so you never under-sample.
Worked Example
Suppose your population is 50,000 people, you want 95% confidence and a 5% margin of error.
- \(z = 1.96\), \(p = 0.5\), \(e = 0.05\), \(N = 50{,}000\)
- Numerator: $$1.96^{2} \times 0.5 \times 0.5 / 0.05^{2} = 0.9604 / 0.0025 = 384.16$$
- Denominator: $$1 + 384.16 / 50{,}000 = 1.00768$$
- $$n = 384.16 / 1.00768 \approx 381.2 \rightarrow \text{rounded up to } \mathbf{382}$$
So you'd need to survey 382 people.
Frequently Asked Questions
Why is \(p\) set to 0.5? When the true proportion is unknown, 0.5 produces the largest possible sample size, ensuring your survey is precise enough regardless of the actual result.
What if my population is very large? For huge populations the correction term becomes negligible, so the sample size approaches the simpler \(n = z^{2}p(1-p)/e^{2}\) (about 385 for 95%/5%).
How do I shrink the required sample? Accept a larger margin of error or a lower confidence level. Tightening either one increases the sample needed substantially.