What is the Pie Chart Maker?
This tool turns a list of category labels and numeric values into a pie chart. For each category it calculates the percentage share of the whole and the slice angle in degrees, then draws the chart so you can see the breakdown at a glance. It works for survey results, market share, budget categories, election seat shares, weather forecasts, school homework, or any set of comparable numbers. The math is pure arithmetic, so it applies the same everywhere with no country-specific rules.
How to use it
Enter a label and a value for each category. Labels are optional; blank labels are auto-named "Item 1", "Item 2", and so on. Leave a row completely empty to skip it. You can add an optional chart title and a start angle (the rotation of the first slice; it does not change the percentages). Values must be zero or greater, since a pie slice cannot have a negative angle.
The formula explained
First the tool sums every value to get the total \(T\). Each category's percentage is its value divided by \(T\), multiplied by 100. Its slice angle is its value divided by \(T\), multiplied by 360, because a full circle is 360 degrees. By definition the percentages add up to 100% and the angles add up to 360° (small differences can appear after rounding). If the total is zero, no division is performed and every slice shows 0% / 0°.
$$\text{Percent}_i = \frac{\text{Value}_i}{\sum \text{Value}} \times 100\% \qquad \text{Angle}_i = \frac{\text{Value}_i}{\sum \text{Value}} \times 360^{\circ}$$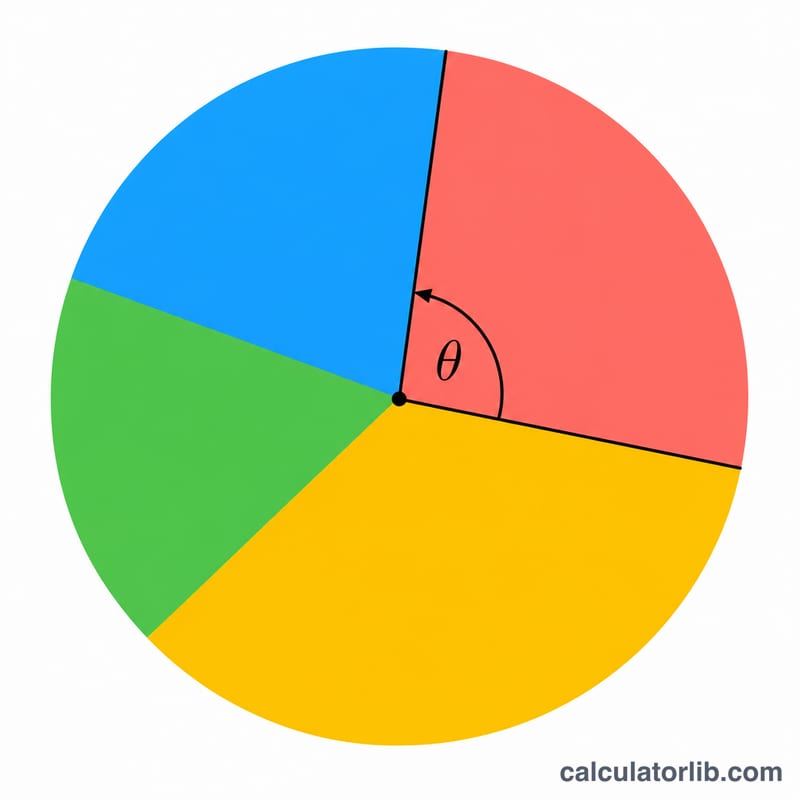
Worked example
Suppose Sunny = 50, Cloudy = 30, Rain = 20. The total is 100. Sunny is \(50/100 \times 100 = 50.0\%\) and \(50/100 \times 360 = 180.0^{\circ}\). Cloudy is 30.0% and 108.0°. Rain is 20.0% and 72.0°. The percentages sum to 100% and the angles sum to 360°, so the chart draws three slices of 180°, 108° and 72°.
FAQ
Do my values have to be percentages? No. Use any consistent unit — people, votes, dollars, counts. The tool converts them to shares automatically.
What if my values do not add up to 100? That is fine. The percentages are computed from the actual total, whatever it is.
Can I use negative numbers? No. A pie slice represents a part of a whole, so negatives are treated as zero.