What this calculator does
This tool shows exactly where any fraction lands on a number line from 0 to 1. Enter a numerator and a denominator and it returns the fraction's decimal value (its position on the line), the same position as a percent, the fraction reduced to lowest terms, and the two standard chart fractions that bracket it. It also draws a visual number line chart of the common fraction families from halves through sixteenths so you can compare relative sizes and spot equivalent fractions at a glance.
How to use it
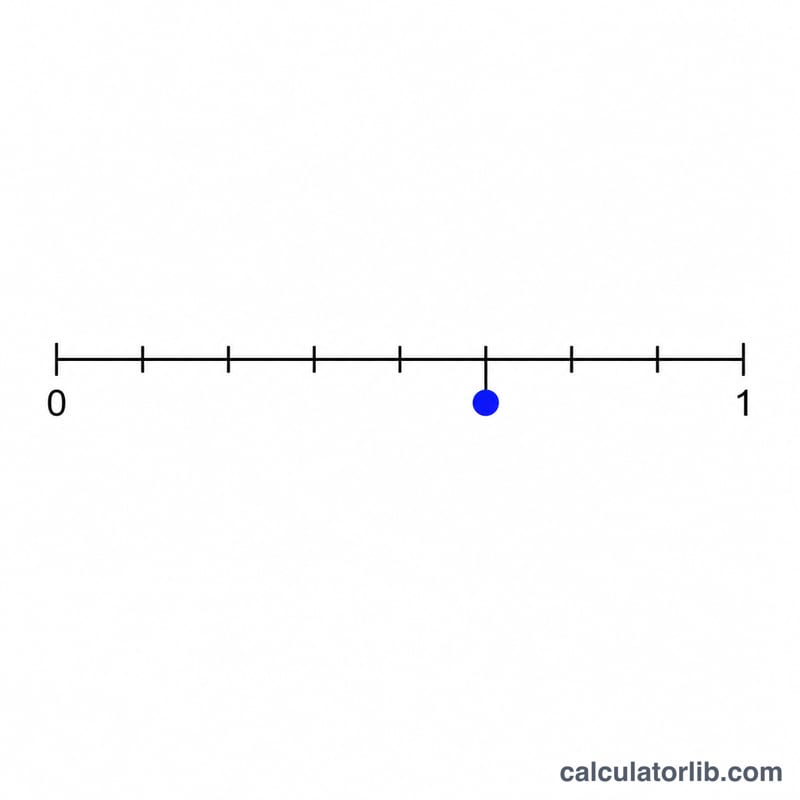
Type the numerator (top number) and the denominator (bottom number). Set the "Chart Detail" value to the largest denominator you want the reference chart to show (2 draws only halves, 16 draws everything through sixteenths). The red marker on the chart shows your fraction's position. Proper fractions land between 0 and 1; improper fractions (numerator larger than denominator) read over 100 percent and fall past the right edge.
The formula explained
The decimal value is simply \(v = \frac{\text{numerator}}{\text{denominator}}\). The percent is that value times 100. To simplify, the calculator finds the greatest common divisor (GCD) of the numerator and denominator using Euclid's algorithm, then divides both by it. The nearest standard fractions are found by building every proper fraction \(\frac{n}{d}\) for \(d\) from 2 up to your chart detail, sorting them, and locating the pair that surrounds your value.
$$ v = \frac{\text{Numerator}}{\text{Denominator}} \qquad \text{Percent} = 100 \times v $$$$ \text{Chart marks: } \frac{n}{d}, \quad d = 2,\dots,\text{Max Denominator}, \;\; n = 1,\dots,d-1 $$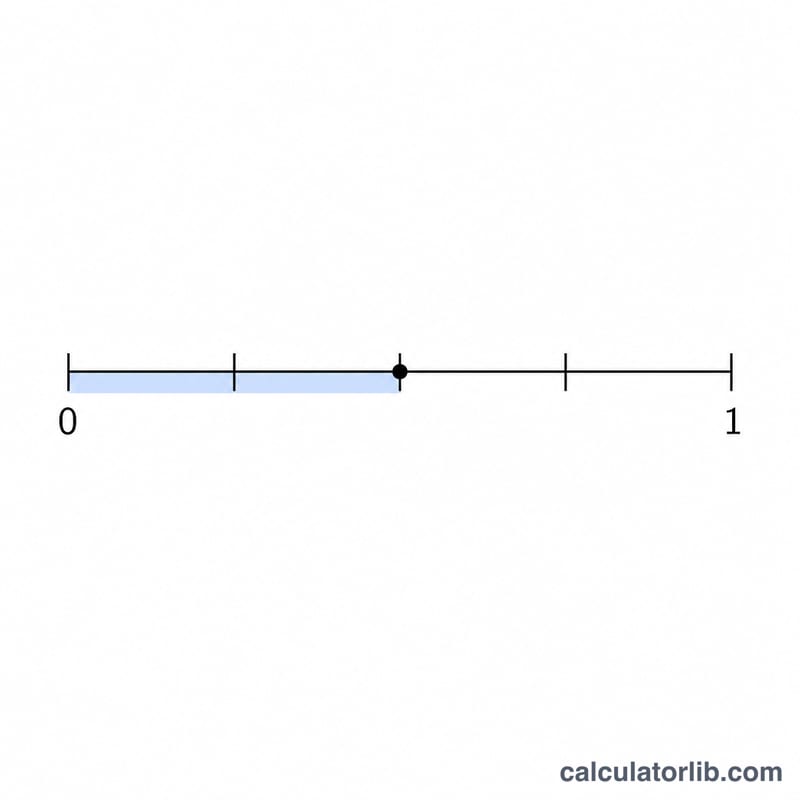
Worked example
For \(\frac{3}{8}\) with chart detail 16: the decimal value is \(0.375\) and the percent is \(37.5\) percent. The GCD of 3 and 8 is 1, so \(\frac{3}{8}\) is already in lowest terms. Because 8 is within the chart range, \(\frac{3}{8}\) sits exactly on a tick; its neighbors are \(\frac{1}{3}\) (\(0.3333\)) below and \(\frac{2}{5}\) (\(0.4\)) above.
FAQ
What if the denominator is zero? Division by zero is undefined, so the calculator returns an error and asks you to use a nonzero denominator.
Why do \(\frac{2}{4}\), \(\frac{3}{6}\) and \(\frac{4}{8}\) all sit in the same spot? They are equivalent fractions, all equal to \(\frac{1}{2} = 0.5\), so they align at the same point on the line. The simplified output shows the shared lowest-terms form.
Can I plot an improper fraction? Yes. For example \(\frac{5}{4} = 1.25 = 125\) percent. The calculator reports this and notes that it lies beyond the standard 0 to 1 range.


