
What is the Pie Chart Angle Calculator?
A pie chart divides a full circle of 360° into wedges, where each wedge's central angle is proportional to the value it represents. This calculator converts a single category value and the overall total into the exact slice angle (in degrees) and the matching percentage, so you can draw or check a pie chart by hand or verify a spreadsheet.
How to use it
Enter the value for the category you want to plot, then enter the total — the sum of every category in your dataset. Press calculate to see the slice angle in degrees and the percentage of the whole. Repeat for each category; all the angles will add up to 360° and all the percentages to 100%.
The formula explained
A full circle is 360°. Since a pie slice should be proportional to its value, you take the fraction the value represents of the total and multiply by 360:
$$\text{Angle} = \frac{\text{Value}}{\text{Total}} \times 360^{\circ}$$
The percentage uses the same fraction multiplied by 100 instead. If the total is zero the angle is undefined, so make sure the total reflects the real sum of your data.
Worked example
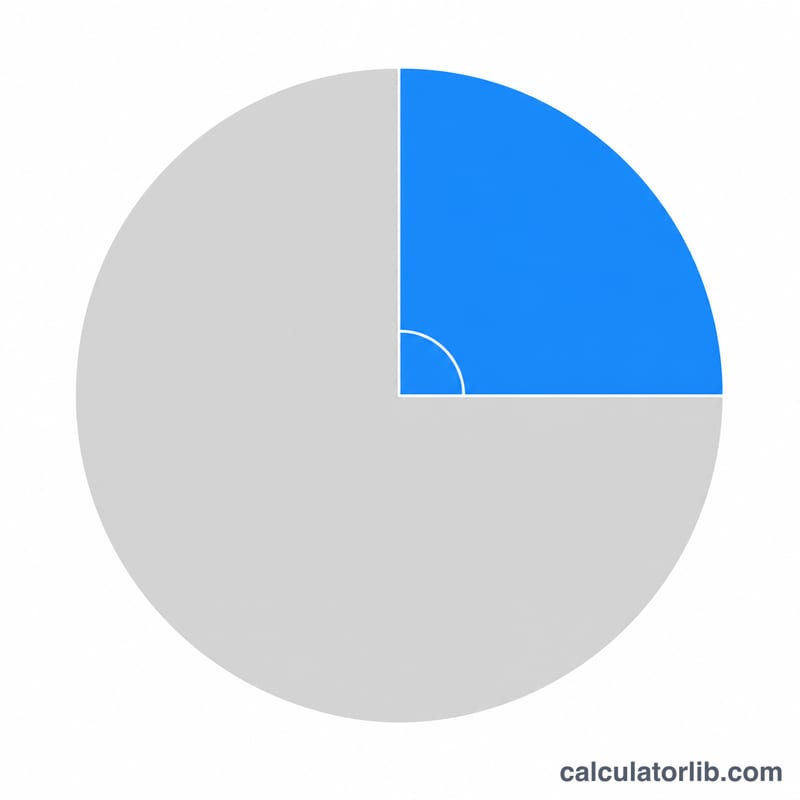
Suppose a budget of $2,000 spends $500 on rent. The fraction is \(500 \div 2000 = 0.25\). The slice angle is $$0.25 \times 360 = 90^{\circ}$$ which is 25% of the pie — a perfect quarter wedge.
FAQ
Do all my slices have to add up to 360°? Yes. If you compute every category against the same total, the angles will sum to 360° and the percentages to 100%.
Can the value be larger than the total? Mathematically yes, which would give an angle over 360°, but that means your total is too small — a real total should be the sum of all values.
What if my data is already in percentages? Use the percentage as the value and 100 as the total; the angle becomes \(\text{percent} \times 3.6\).