What is the Pie Chart Percentage Calculator?
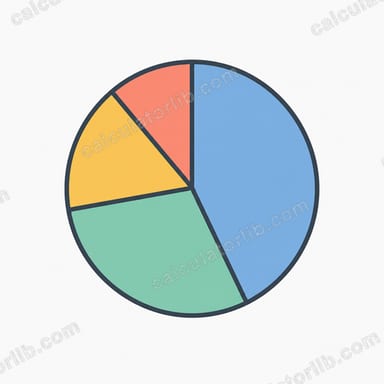
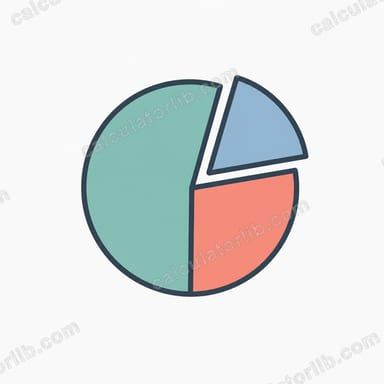
A pie chart shows how individual parts compare to a whole, where the entire circle represents 100% (or 360°). This calculator converts any single value into its percentage share of a total, and also returns the exact slice angle in degrees so you can draw the chart accurately by hand or in any graphics tool.

How to use it
Enter the value of the slice you care about and the total (the sum of all values). The calculator divides the value by the total, multiplies by 100 for the percentage, and by 360 for the slice angle. Both results update instantly.
The formula explained
The core relationship is percentage = (value ÷ total) × 100. Because a full circle is 360°, the matching slice angle is degrees = (value ÷ total) × 360. Every percentage point equals 3.6 degrees, so 25% is always a 90° quarter slice.
$$\text{Percentage} = \frac{\text{Value}}{\text{Total}} \times 100\%$$
$$\text{Degrees} = \frac{\text{Value}}{\text{Total}} \times 360^{\circ}$$

Worked example
Suppose 45 of 360 survey respondents chose option A. The percentage is $$(45 \div 360) \times 100 = 12.5\%,$$ and the slice angle is $$(45 \div 360) \times 360 = 45^{\circ}.$$ So option A occupies a 45-degree wedge that fills one-eighth of the chart.
Common Percentages and Their Pie Slice Angles
A full circle is 360°, so every 1% of a pie chart takes up 3.6°. The slice angle is \(\text{Angle} = \text{Percentage} \times 3.6^\circ\), or equivalently \(\text{Fraction} \times 360^\circ\).
| Percentage | Fraction of circle | Angle (degrees) |
|---|---|---|
| 1% | 1/100 | 3.6° |
| 5% | 1/20 | 18° |
| 10% | 1/10 | 36° |
| 12.5% | 1/8 | 45° |
| 20% | 1/5 | 72° |
| 25% | 1/4 | 90° |
| 30% | 3/10 | 108° |
| 33.3% (≈ 1/3) | 1/3 | 120° (exactly 1/3 of 360°; 33.3% rounded gives 119.88°) |
| 40% | 2/5 | 144° |
| 50% | 1/2 | 180° |
| 60% | 3/5 | 216° |
| 75% | 3/4 | 270° |
| 80% | 4/5 | 288° |
| 90% | 9/10 | 324° |
| 100% | 1 | 360° |
How to Build a Full Pie Chart by Hand
- Sum all category values to get the total. For example, 120 + 80 + 60 + 40 = 300.
- Divide each value by the total to get its share as a decimal: \(\frac{ {\text{Value}}}{ {\text{Total}}}\).
- Multiply by 100 for the percentage and by 360 for the degrees: \(\text{Percentage} = \frac{ {\text{Value}}}{ {\text{Total}}} \times 100\%\) and \(\text{Angle} = \frac{ {\text{Value}}}{ {\text{Total}}} \times 360^\circ\).
- Check your work. The percentages should add up to 100% and the angles to 360°. Small differences (such as 99.9% or 360.2°) come from rounding and are normal.
- Draw the slices with a protractor. Draw a circle and a radius line pointing to 12 o'clock. Measure the first angle clockwise from that line, then start the next slice where the previous one ended. Repeat until the circle is full, then label each slice.
Example: One Dataset Converted to Percentages and Angles
Suppose a small monthly budget has four categories with a total of 300 (in any unit, such as dollars or hours). Each row uses \(\frac{ {\text{Value}}}{300}\times 100\%\) and \(\frac{ {\text{Value}}}{300}\times 360^\circ\). For the second category, \(\frac{80}{300}\times 100\% \approx\) 26.67%, and \(\frac{80}{300}\times 360^\circ = 96^\circ\).
| Category | Value | Percentage | Angle |
|---|---|---|---|
| A | 120 | 40% | 144° |
| B | 80 | 26.67% | 96° |
| C | 60 | 20% | 72° |
| D | 40 | 13.33% | 48° |
| Total | 300 | 100% | 360° |
Rounding note: B and D are repeating decimals (26.666…% and 13.333…%). At two decimals the column sums to exactly 100%. Rounded to whole numbers (40%, 27%, 20%, 13%) it also sums to 100% here, but with other datasets whole-number rounding can give 99% or 101%. In that case keep one or two decimals, or adjust the largest slice's label slightly. Always compute angles from the unrounded share, not the rounded percentage.
FAQ
Why does the angle matter? When drawing a pie chart manually, you need the central angle to mark each wedge with a protractor.
What if my total is the sum of several categories? Add all category values together to get the total, then run each category through this calculator to get its percentage.
Can the percentage exceed 100%? Only if the value is larger than the total, which usually means the total was entered incorrectly.