
What is quadratic regression?
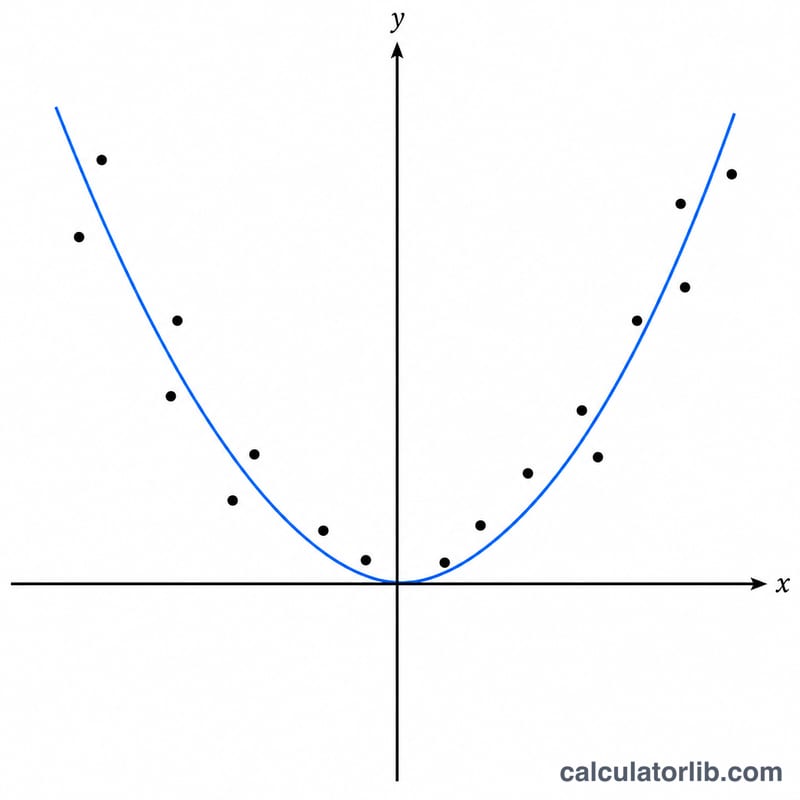
Quadratic regression fits a second-degree polynomial of the form \(y = A + B\cdot x + C\cdot x^{2}\) to a set of paired observations (x, y). Unlike a straight line, a parabola can capture curvature — data that rises then falls, or accelerates — so it is widely used in physics (projectile motion), economics (cost curves), and any setting where the relationship between two variables bends. This is pure mathematics and statistics: the method works the same anywhere and uses no regional rules or units.
How to use the calculator
Enter your data points in the box, one pair per line, with x and y separated by a space or comma (for example 3, 5). You need at least three points to determine the three coefficients A, B, and C; more points give a more reliable fit. Choose how many significant digits to display, then read off A, B, C, the assembled regression equation, and the correlation coefficient r.
The formula explained
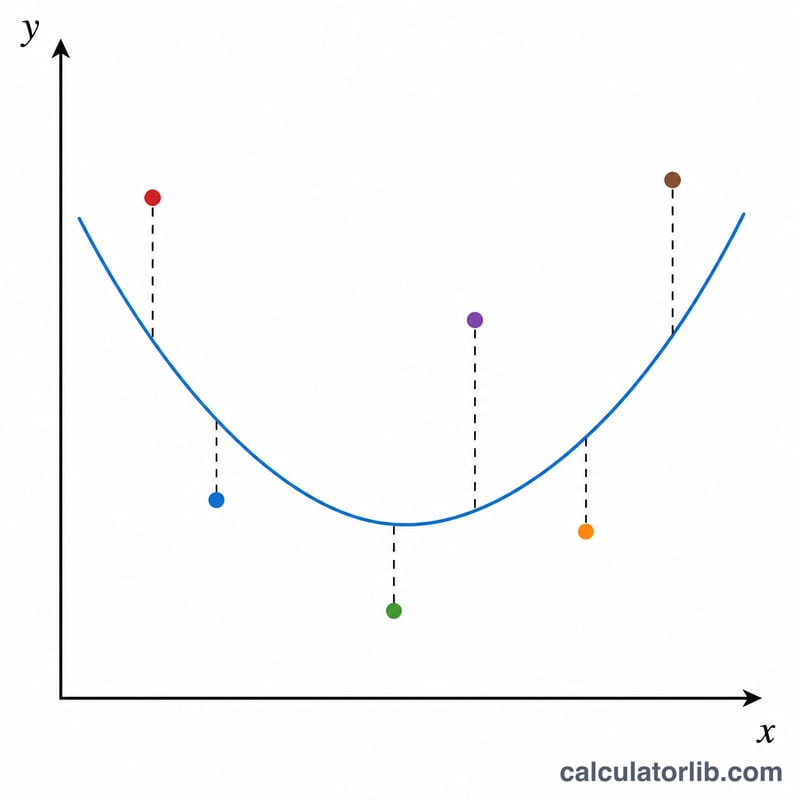
The coefficients come from least squares. With n points, compute the means \(\bar{x}\), \(\bar{y}\) and the mean of squares \(\overline{x^2}\). Then form the centered sums \(S_{xx}\), \(S_{xy}\), \(S_{xx^2}\), \(S_{x^2x^2}\) and \(S_{x^2y}\) using the raw-moment identities (e.g. \(S_{xx} = \Sigma x^{2} - n\cdot\bar{x}^{2}\)). With \(\text{denom} = S_{xx}\cdot S_{x^2x^2} - S_{xx^2}^{2}\), the coefficients are $$B = \frac{S_{xy}\,S_{x^2x^2} - S_{x^2y}\,S_{xx^2}}{\text{denom}},\quad C = \frac{S_{x^2y}\,S_{xx} - S_{xy}\,S_{xx^2}}{\text{denom}},\quad A = \bar{y} - B\,\bar{x} - C\,\overline{x^2}.$$ The correlation coefficient r is the square root of 1 minus the ratio of the residual sum of squares to the total sum of squares.
Worked example
For the points (1,1), (2,2), (3,5), (4,10), (5,17): \(n = 5\), \(\bar{x} = 3\), \(\bar{y} = 7\), \(\overline{x^2} = 11\). This gives \(S_{xx} = 10\), \(S_{xy} = 40\), \(S_{xx^2} = 60\), \(S_{x^2x^2} = 374\), \(S_{x^2y} = 254\), \(\text{denom} = 140\). Then \(B = -2\), \(C = 1\), \(A = 2\). The fit is \(y = 2 - 2x + x^{2}\), which passes through every point exactly, so \(r = 1\).
FAQ
How many points do I need? At least three distinct x-values; with fewer, or with all x equal, the system is degenerate and cannot be solved.
What does r mean? As a rough guide, \(0.7<|r|\le 1\) is strong, \(0.4<|r|<0.7\) moderate, \(0.2<|r|<0.4\) weak, and below 0.2 essentially none. A value of 1 means the parabola passes through every point.
Why is r never negative here? This calculator reports the non-negative root of the coefficient of determination, so r ranges from 0 to 1 regardless of the curve's direction.


