What is the Number Line Plot Calculator?
This tool takes a single real number and places it as a point on a one-dimensional number line. It is a pure math visualization aid that helps learners see the magnitude and sign of a value relative to zero, and relative to a sensibly scaled axis. The number can be positive, negative, zero, fractional, or very large — the calculator chooses a clean axis automatically.
How to use it
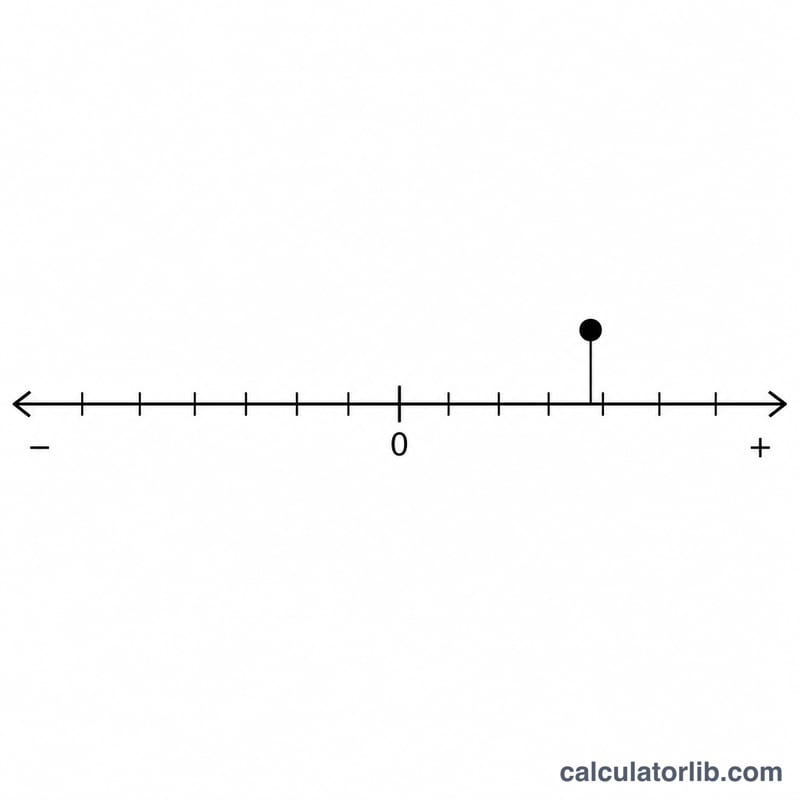
Enter your value and submit. The calculator returns the plotted value, the axis minimum and maximum, the tick spacing, and the normalized position (a fraction between 0 and 1 that tells you how far along the axis the marker sits). A drawn number line shows a red marker at exactly that fraction.
The scale algorithm explained
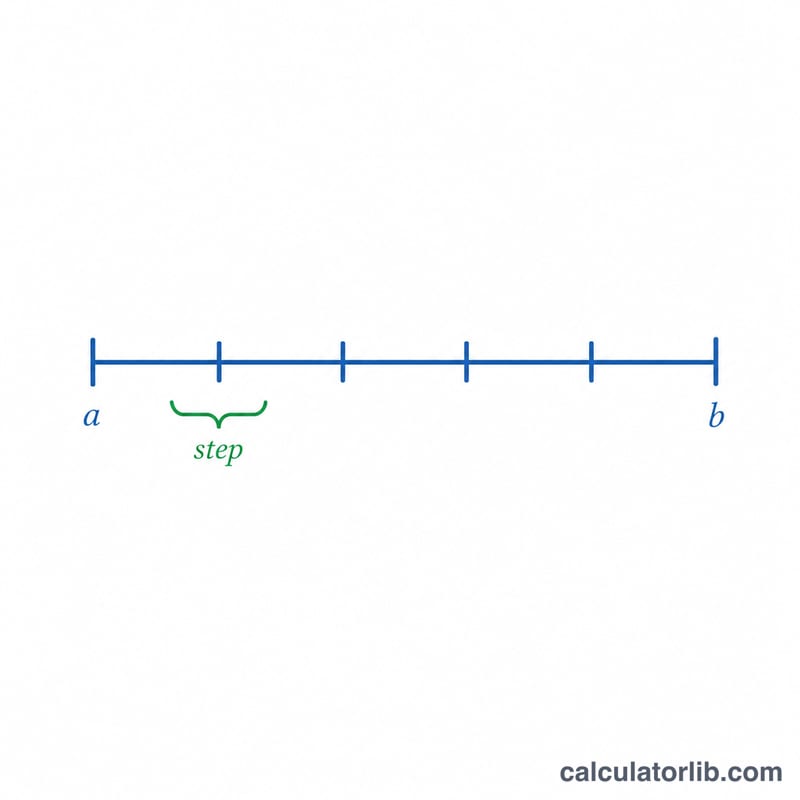
If the value is zero, a symmetric axis from -1 to 1 is used with ticks every 0.5 (this also avoids a zero-width axis). Otherwise the calculator works from the absolute value a. It computes exp = floor(log10(a)) and f = a / 10exp so that \(1 \le f < 10\), then rounds f up to the nearest of 1, 2, 5, or 10 to get a round bound that comfortably contains the value. Positive values get an axis from 0 to the bound; negative values get an axis from the negative bound up to 0. Tick spacing is bound divided by 5, giving five clean divisions. If the value lands exactly on the bound, the bound is bumped to the next nice number so the marker is not stuck on the edge.
Worked example
For value = 50: \(a = 50\), exp = 1, \(f = 5\), niceF = 5, bound = 50. Since 50 equals the bound, it bumps to 100. So axisMin = 0, axisMax = 100, tickStep = 20 (ticks at 0, 20, 40, 60, 80, 100). The normalized position is $$\frac{50 - 0}{100 - 0} = 0.5,$$ so the marker sits exactly halfway.
FAQ
Can I plot a negative number? Yes. A value of -3 produces an axis from -5 to 0 with the marker 40% from the left end.
What does normalized position mean? It is the fraction (0 to 1) of the way along the axis where the marker sits — 0 is the left end, 1 is the right end.
Is this region-specific? No. It is universal mathematics and works for any real number.