
What Is a 5-Number Summary?
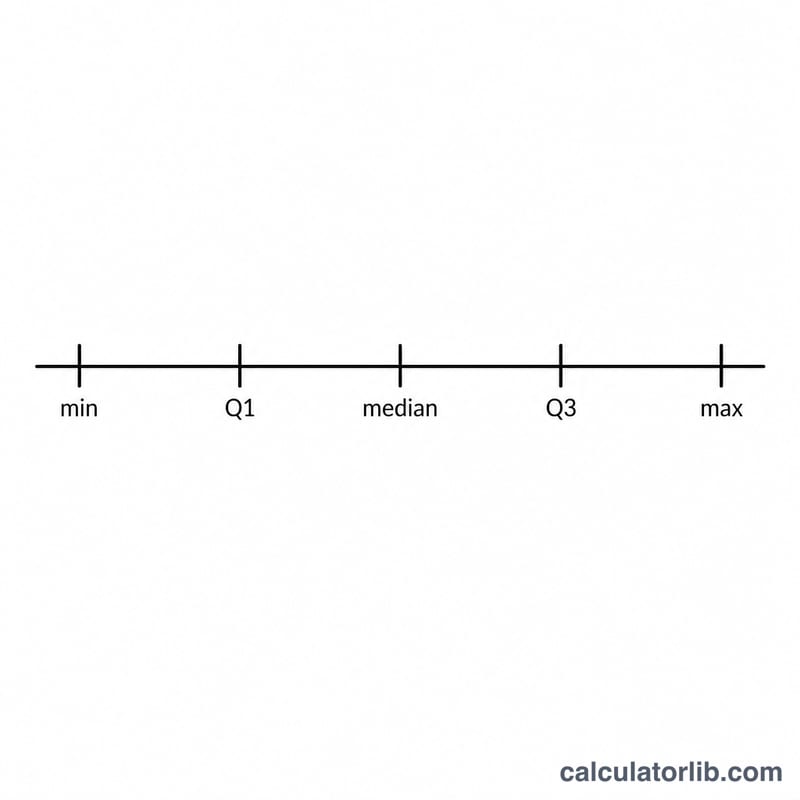
A five-number summary is a quick statistical snapshot that describes the spread and center of a dataset using just five values: the minimum, the first quartile (Q1), the median, the third quartile (Q3), and the maximum. Together these numbers divide your data into four equal parts and reveal where values cluster, how widely they range, and whether the distribution leans to one side. This calculator works for any list of numbers and is widely used in statistics classes, data analysis, and business reporting worldwide.
How to Use the Calculator
Simply enter your values separated by commas — for example, 4, 8, 15, 16, 23, 42 — and the tool instantly returns all five summary numbers. The order you type them in does not matter; the calculator sorts them automatically before computing.
- Minimum: the smallest value in your data.
- Q1 (first quartile): the median of the lower half — 25% of values fall below it.
- Median (Q2): the middle value — 50% of values fall below it.
- Q3 (third quartile): the median of the upper half — 75% of values fall below it.
- Maximum: the largest value in your data.
How the Five Numbers Are Calculated
First, the data is sorted from lowest to highest. The minimum and maximum are simply the ends of that list. The median is the middle value (or the average of the two middle values when the count is even). Q1 is the median of the lower half of the data, and Q3 is the median of the upper half. The distance between Q1 and Q3, called the interquartile range (\(\text{IQR} = Q_3 - Q_1\)), measures the spread of the middle 50% and helps spot outliers.
$$\text{5-Number Summary} = \left\{\ \min,\ Q_1,\ \tilde{x},\ Q_3,\ \max\ \right\} \text{ of } \text{Data Set}$$
$$\begin{aligned} \text{Sorted: } & x_{(1)} \le x_{(2)} \le \dots \le x_{(n)} \text{ from } \text{Data Set} \\ \min &= x_{(1)} \\ Q_1 &= P_{25} \\ \tilde{x} &= P_{50} \\ Q_3 &= P_{75} \\ \max &= x_{(n)} \\ \text{IQR} &= Q_3 - Q_1 \end{aligned}$$
Worked Example
Take the dataset: 2, 4, 6, 8, 10, 12, 14 (seven values).
- Minimum = 2, Maximum = 14
- Median = 8 (the fourth value)
- Lower half = 2, 4, 6 → Q1 = 4
- Upper half = 10, 12, 14 → Q3 = 12
So the five-number summary is 2, 4, 8, 12, 14, and the IQR is \(12 - 4 = 8\).
Interpreting Your Five-Number Summary
The five-number summary—minimum, first quartile (\(Q_1\)), median (\(\tilde{x}\)), third quartile (\(Q_3\)), and maximum—splits your sorted data into four equal-count quarters. Reading these five anchors together tells you where the data center sits, how spread out it is, and whether it leans to one side.
IQR: the spread of the middle 50%
The interquartile range is the distance between the quartiles:
$$\text{IQR} = Q_3 - Q_1$$It captures the spread of the central 50% of your values and ignores extreme tails, so it is far more robust than the full range \((\max-\min)\). A small IQR relative to the range means most values are tightly clustered while a few stragglers stretch the ends.
Comparing gaps to detect skew
Compare the lower gap \((Q_1-\min)\) with the upper gap \((\max-Q_3)\), and the inner halves \((\tilde{x}-Q_1)\) versus \((Q_3-\tilde{x})\):
- Roughly symmetric: the two gaps are similar and the median sits near the middle of the IQR.
- Right-skewed (positive): the upper gap \((\max-Q_3)\) is much larger; the median sits closer to \(Q_1\).
- Left-skewed (negative): the lower gap \((Q_1-\min)\) is much larger; the median sits closer to \(Q_3\).
The 1.5×IQR rule for outliers
A common rule flags values that fall outside the fences:
$$\text{Lower fence}=Q_1-1.5\times\text{IQR},\qquad \text{Upper fence}=Q_3+1.5\times\text{IQR}$$Any data point below the lower fence or above the upper fence is a candidate outlier worth inspecting. You can run your data through an IQR outlier check to apply this rule automatically.
How the box plot maps to the summary
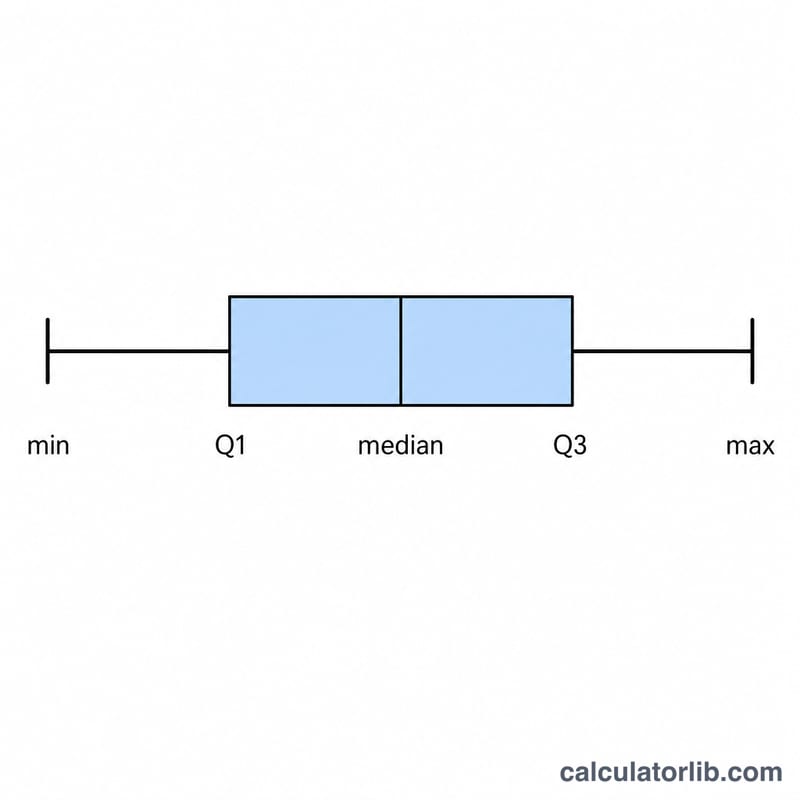
A box plot is a direct picture of these five numbers: the box spans from \(Q_1\) to \(Q_3\) (its length is the IQR), the line inside the box marks the median, and the whiskers extend out to the smallest and largest values within the fences. Points beyond the whiskers are drawn individually as outliers. So the box shows the middle 50%, and a median line off-center inside the box is your visual cue for skew.
Key Terms & Definitions
- Minimum
- The smallest value in the data set—the lower end of the range.
- First Quartile (\(Q_1\))
- The 25th percentile: 25% of the data fall at or below this value. It marks the lower edge of the box in a box plot.
- Median (\(Q_2\), \(\tilde{x}\))
- The 50th percentile—the middle value of the sorted data (the average of the two middle values when the count is even). Half the data lie below it and half above.
- Third Quartile (\(Q_3\))
- The 75th percentile: 75% of the data fall at or below this value. It marks the upper edge of the box.
- Maximum
- The largest value in the data set—the upper end of the range.
- Percentile
- A value below which a given percentage of observations fall; e.g., the 25th percentile is the point with 25% of the data at or below it.
- Interquartile Range (IQR)
- The difference \(Q_3-Q_1\), measuring the spread of the central 50% of the data. See the IQR calculator for a focused computation.
- Box Plot (box-and-whisker)
- A chart that displays the five-number summary: a box from \(Q_1\) to \(Q_3\) with a median line, whiskers reaching to the extreme non-outlier values, and any outliers plotted as separate points.
Frequently Asked Questions
Why do quartile results sometimes differ between tools? There are several accepted methods for calculating quartiles (such as inclusive and exclusive medians). Small datasets can produce slightly different Q1 and Q3 values depending on the method used.
What is a five-number summary used for? It is the basis for box-and-whisker plots, a fast way to compare distributions, detect skew, and identify potential outliers.
How many numbers do I need? You need at least two values, but the summary becomes more meaningful with five or more data points.