
What Is a Frequency Distribution Calculator?
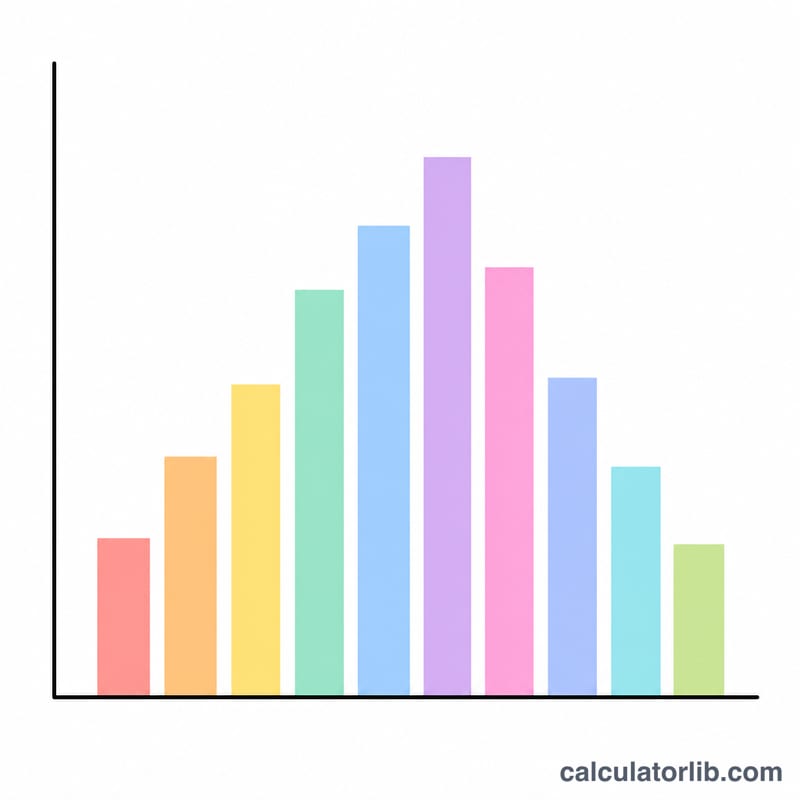
A Frequency Distribution Calculator organizes raw data into a clear, summarized table that shows how often each value or range of values appears in a data set. Instead of scanning a long list of numbers, you get an at-a-glance picture of where your data clusters, where the gaps are, and how spread out the values are. This calculator also computes key summary statistics — the mean, median, and standard deviation — and lets you customize bin sizes so you can group continuous data into meaningful intervals.
How to Use the Calculator
- Enter your data values, separated by commas or spaces (for example: 12, 15, 15, 18, 22, 22, 22, 30).
- Choose how you want the data grouped — either by individual values or by class intervals (bins).
- Set a bin size or number of bins if you are grouping ranges of data.
- Click calculate to generate the frequency table, relative and cumulative frequencies, and the summary statistics.
The Formulas Explained
A frequency table lists each value or class alongside how many times it occurs. Two related measures add context:
- Relative frequency = frequency ÷ total count. It expresses each frequency as a proportion or percentage.
- Cumulative frequency = running total of frequencies up to and including a class.
The summary statistics use standard formulas: the mean is the sum of all values divided by the count; the median is the middle value when data is sorted; and the standard deviation measures how far values typically fall from the mean, calculated as the square root of the average squared deviation.
$$\begin{gathered} k = \left\lceil \frac{\max - \min}{h} \right\rceil, \qquad f_i = \#\{\, x : L_i \le x < L_i + h \,\} \\[1.5em] \text{where}\quad \left\{ \begin{aligned} x &= \text{Data values} \\ h &= \text{Bin Size} \;\text{or}\; \left\lceil \sqrt{n} \right\rceil \\ L_i &= \min + i\,h \end{aligned} \right. \end{gathered}$$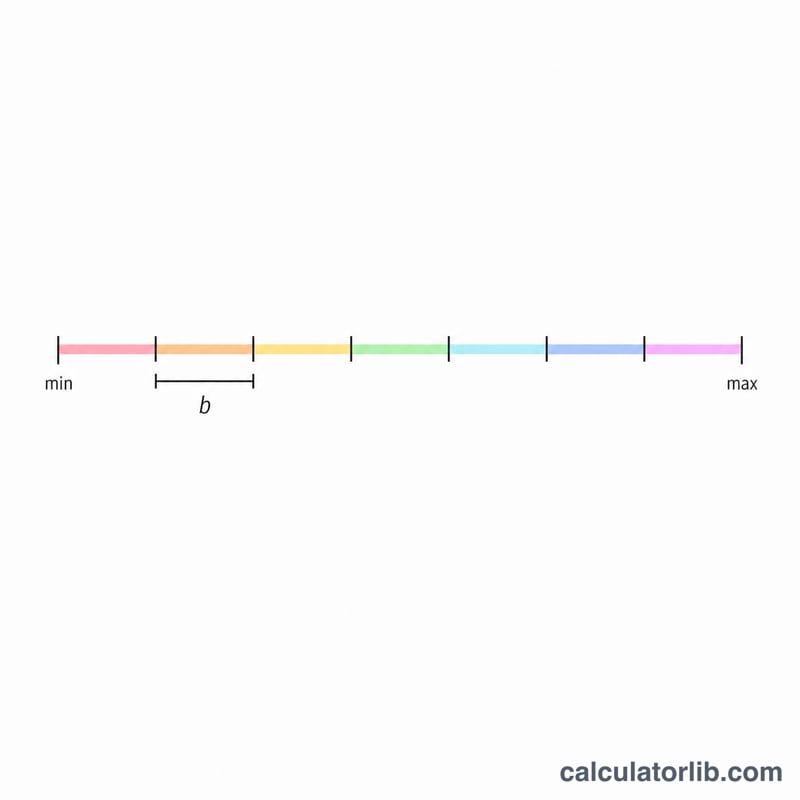
Worked Example
Suppose you collect test scores: 70, 75, 75, 80, 80, 80, 85, 90. The value 80 appears three times, so its frequency is 3 and its relative frequency is \(3 \div 8 = 0.375\) (37.5%). The mean is $$(70+75+75+80+80+80+85+90) \div 8 = 79.4.$$ With 8 values, the median is the average of the 4th and 5th sorted values: $$(80+80) \div 2 = 80.$$ The standard deviation comes out to about 6.0, showing scores stay fairly close to the mean.
Frequently Asked Questions
What is the best number of bins to use? A common rule of thumb is the square root of the number of data points, but you can adjust bins to reveal the pattern most clearly. Too few bins hide detail; too many create noise.
What is the difference between frequency and relative frequency? Frequency is the raw count of occurrences, while relative frequency is that count as a fraction or percentage of the total, making it easier to compare data sets of different sizes.
Can I use this for grouped continuous data? Yes. Set a bin width to group continuous values into intervals such as 0–9, 10–19, and so on, then read off the frequency for each range.